2.1 RNA expression analysis
We used the NEUMA program for quantifying transcript abundance. Since NEUMA maps sequence reads to the established transcriptome, identification of novel isoforms is not supported. However, its major merit is the accuracy of quantification as its algorithm mimics the process of real time PCR (agreement ratio over 0.9 with the experimental data).
Mapping and quantification Mapping of the paired end sequences was carried out using NEUMA6 (version v1.1.1) and Bowtie7 (version 0.12.7) on the hg19 Refseq RNA sequences (release 47) downloaded from the UCSC Genome Browser (http://genome.ucsc.edu). For 78- bp paired-end data, Bowtie was run with the –v 0 –a −maxins 600 option, i.e. retrieving all aligned positions, allowing only perfect matches and cDNA fragment size of 79-600 bp. The same range of cDNA fragment sizes was used for calculating the normalization factors for each transcript. We mapped all reads to 36,475 RNA isoforms corresponding to 22,744 genes within hg19 RefSeq RNA sequences. Summary of mapping RNA-Seq data is provided in the Supplementary Table 3. Then we chose to use the abundance estimates of only 31,841 mRNA isoforms (20,990 coding genes), taking into consideration the poly-A selection step in the RNA-Seq experimental procedure. Hierarchical clustering of RNA reads led to two separate groups of normal and tumor tissues in a manner consistent across all 6 patients validating the functional significance of the gene expression profiles. The RNA-Seq data and results of NEUMA quantification are deposited in GEO123.
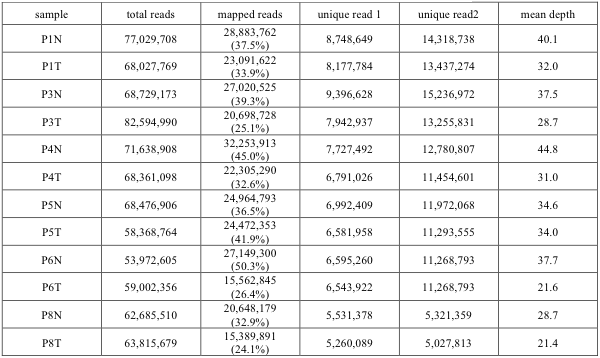
Supp. Table 3. RNA-Seq data mapping summary
Identification of differentially expressed transcripts We chose to use the edgeR8 program to detect differential expression mainly because it supports the experimental design using paired samples (i.e. tumor-normal pairs from the same person). However, we were hampered by a number of cases of low-level expression genes or cases of differential expression in only one or two patients. Thus, we devised several filtering steps to isolate only the significant differential expression. Four conditions must be met to be selected as differentially expressed genes (DEGs) or differentially expressed isoforms (DEIs) – (i) overall differential expression from edgeR analysis with FDR < 0.001, (ii) minimum 3 patients with significant differential expression as tested by edgeR for individual differential expression with FDR < 0.01, (iii) consistent up/down regulation among different patients of over two fold change, and (iv) significant expression in at least 3 patients to remove genes with large fold changes within noise expression level (FVKM>2 in either normal or tumor tissue). In total, we selected 1459 genes (543 up-regulated and 916 down-regulated in tumors) differentially expressed in never-smoker female NSCLC patients. A similar calculation for isoforms yielded 1320 DEIs (460 up-regulated and 860 down-regulated in tumors). The numbers of DEGs and DEIs according to nPatDE (number of patients with significant differential expression in edgeR with FDR<0.01) and nPat2fold (number of patients over 2-fold expression change) are summarized on Supplementary Table 4. The full lists of DEGs and DEIs are provided in the Supplementary File 1.
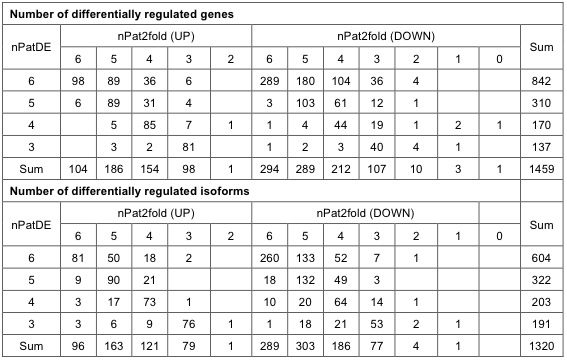
Supp. Table 4. Number of differentially regulated genes and isoforms