2.3 Samll RNA-seq
Supplementary Table 7 shows the statistics of read mapping for each patient data. On average, 70% and 76% of the total reads were mapped to the known microRNAs in normal and tumor tissues, respectively. Interestingly, the portion of mapped microRNAs was consistently higher by 5-6% in tumor samples. The length distribution of reads is shown in Supplementary Fig. 5. Reads in the range of 20-23 bp occupy 87.2% of the total reads, reflecting abundance of microRNAs among various groups of small RNAs. MicroRNA abundance was quantified by utilizing TMM normalization program11. The raw and normalized expression data were uploaded in GEO123.

Supp. Table 7. Mapping statistics of small RNA-Seq data
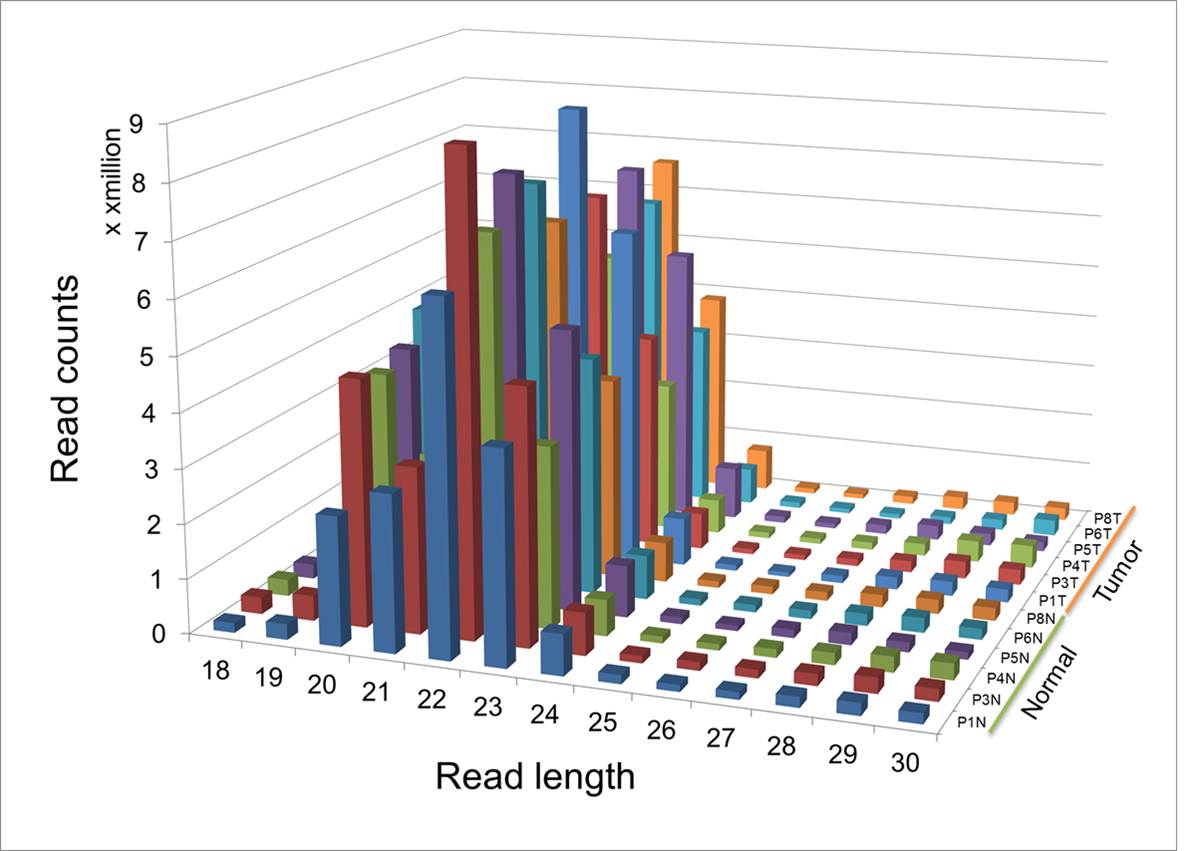
Supp. Fig. 5. Length distribution of small RNA-Seq data (in RPM)
Differentially expressed microRNAs (DEmiRs) were determined by using a similar process described above for mRNA. Four conditions should be met to be selected as DEmiRs – (i) overall differential expression from the edgeR analysis with FDR < 0.001, (ii) minimum 3 patients with significant differential expression as tested by edgeR for individual differential expression with FDR < 0.01, (iii) consistent up/down regulation among different patients of over two fold change, and (iv) significant expression in at least 3 patients. For the last condition, we examined the distribution of normalized microRNA expression values in each patient and determined the upper 25 percentile as significantly expressed microRNA. Thus, the larger of the expression values in either tumor or normal tissues should be within upper 25% in at least 3 patients to be eligible as a DEmiR. We found 40 DEmiRs (23 up- regulated and 17 down-regulated microRNAs in cancer) satisfying these conditions (Supplementary Table 8).
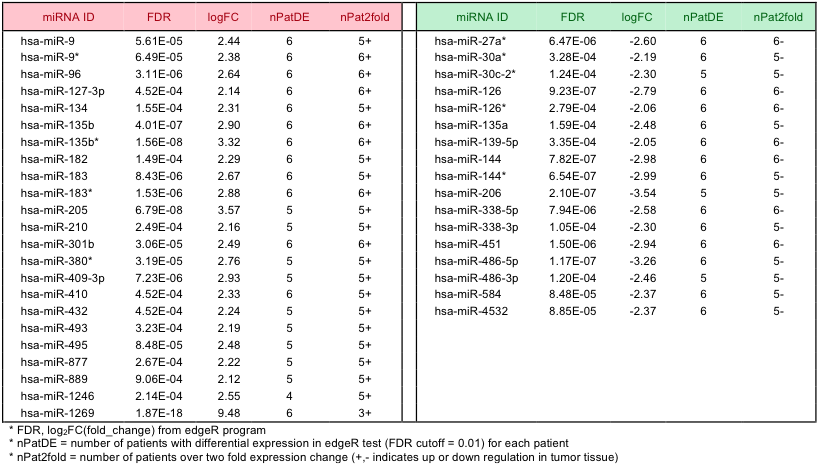
Supp. Table 8. List of differentially expressed microRNAs
To identify additional microRNAs that could be functionally important, we further investigated the anti-correlated expression between microRNAs and target genes. Targets were limited to the DEGs for this analysis. For DEmiR-DEG relations, we used both the validated and predicted microRNA-target relations. Validated target relations were obtained by merging the miRecords12 (version 3), miRTarBase13 (version 2.5), TarBase14 (version 5) and miRWalk15 (last update 11, 2011) databases that collected published results from the literature, and the predicted targets were obtained using TargetScan16 (version 6). With the Pearson correlation cutoff of -0.5, the P-value cutoff of 0.05, we identified 151 anti-correlated relations among (14 validated and 137 predicted). For exploring anti-correlated ‘non- DEmiR’-DEG relations, we used the validated targets only to reduce false positives. Using the same cutoffs and additional requirement of two fold change in microRNA expression, we obtained 53 anti-correlated relations. In total, we obtained 204 anti-correlated relations between 31 microRNAs and 165 DEGs (Supplementary Table 9). We also illustrated the anti- correlated relations in microRNA-centric network as shown in Supplementary Fig. 6.
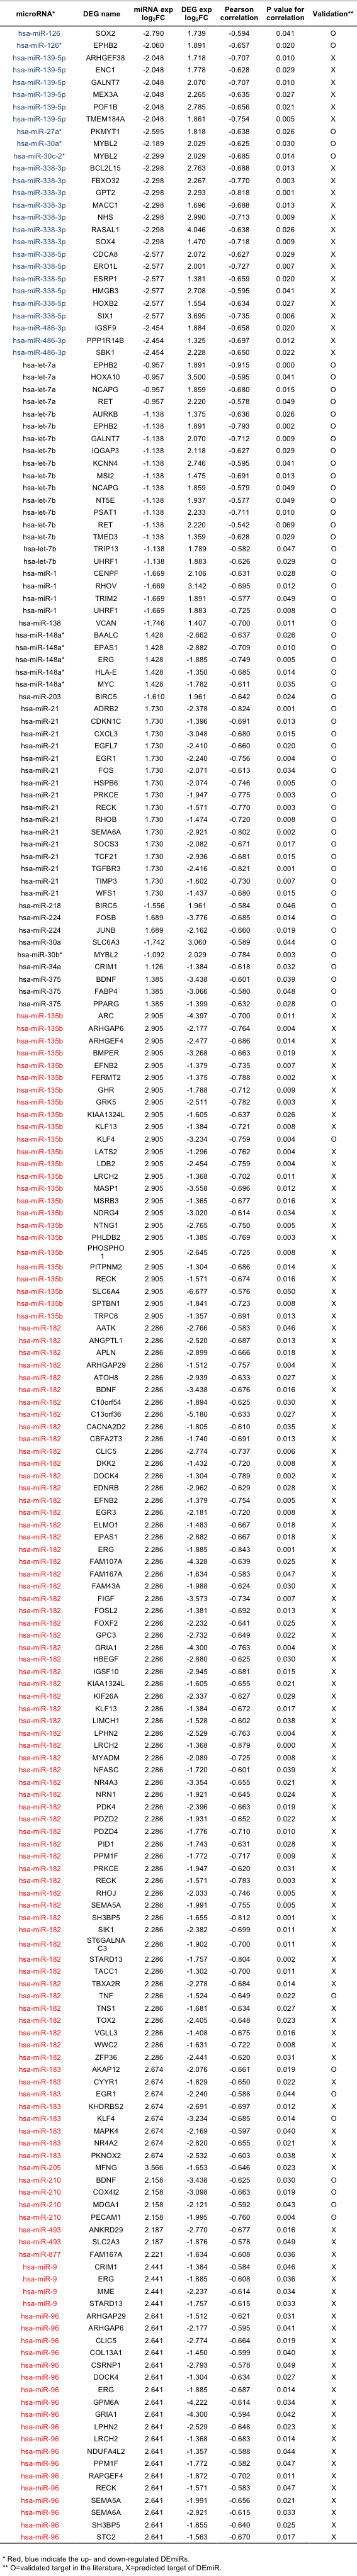
Supp. Table 9. Anti-correlated microRNA-target relations
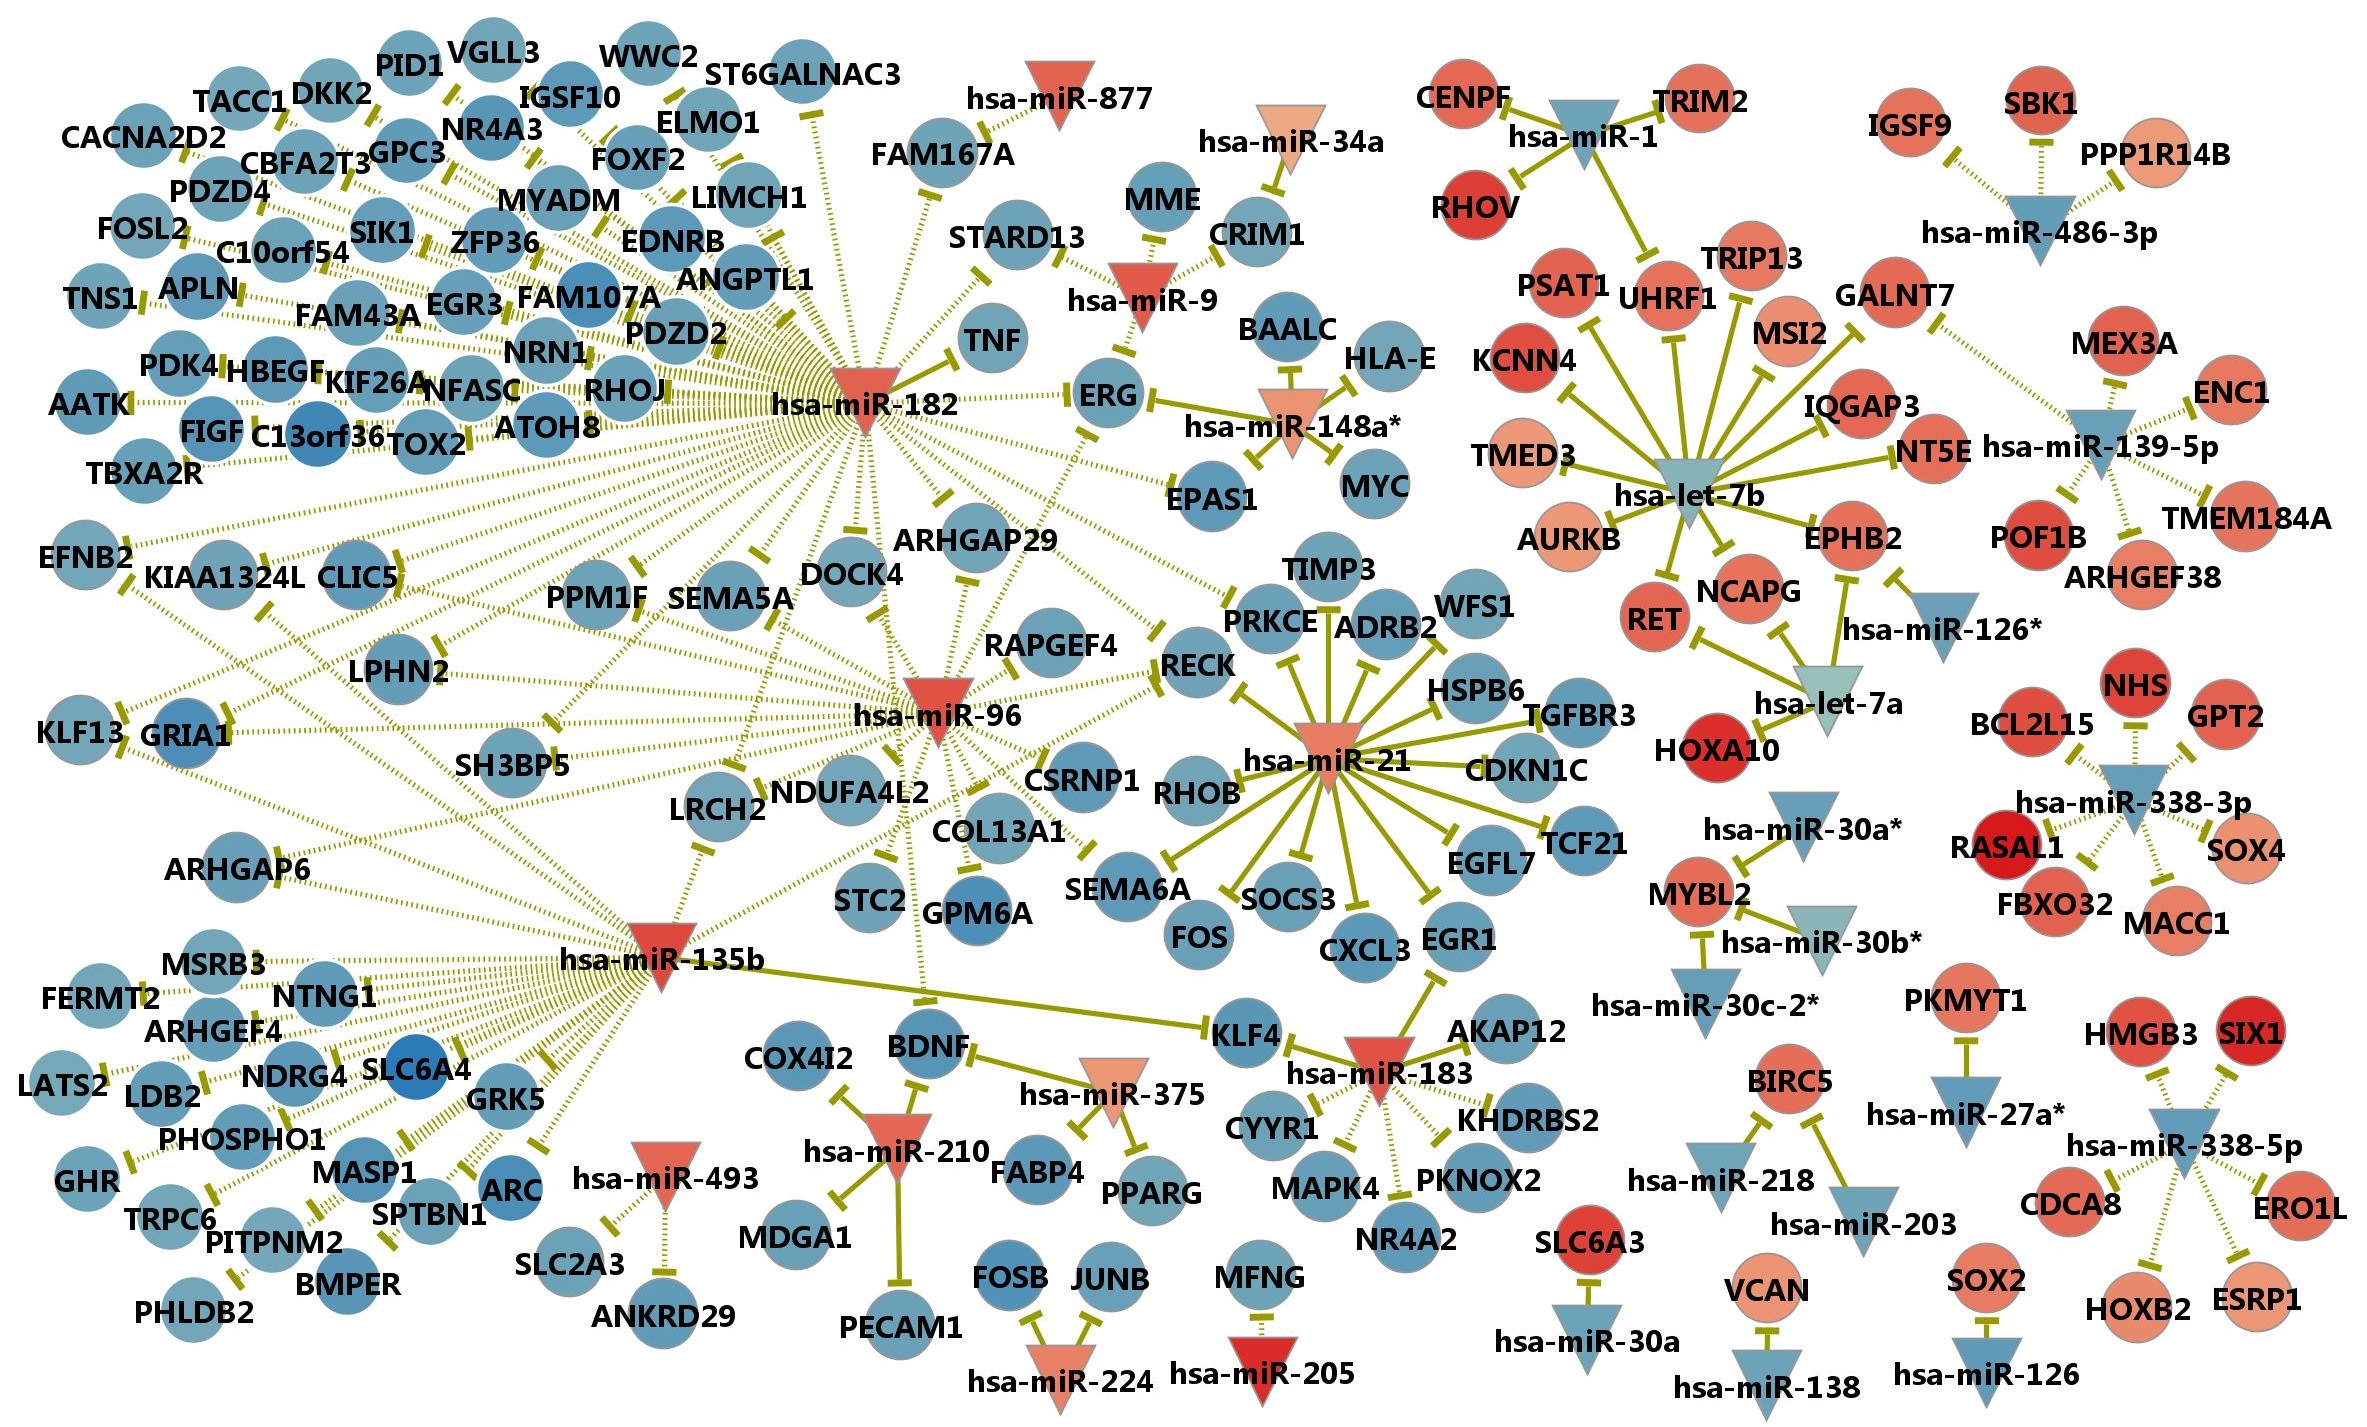
Supp. Fig. 6. MicroRNA-target relations with anti-correlated expression
Overall, we have identified 40 DEmiRs and 13 additional anti-correlated microRNAs that could play important roles in lung cancer development. The expression plot of these functionally important microRNAs in each patient is provided in the Supplementary File 2.