4. Network and Functional Analysis
4.1 Functional analysis of DEGs, somatic mutations, and fusion genes
We obtained 1536 genes of potential functional importance by collecting 1459 DEGs, 46 somatic mutations, and 39 fusion genes. Several genes of somatic mutations (EML1, P2RY1, PRG4, TUBB1) or involved in fusion (GRHL2, RET, LAPTM4B, LRRC36) were differentially expressed as well even though the causal relationship was not explored here. Ingenuity Pathway Analysis (IPA) software was used to look for statistical enrichment of functional terms in these 1536 genes. The Benjamini-Hochberg multiple test correction was used with other options at the default setting. Important results are described in the main text. The bar plot of significant terms are shown in the Supplementary Fig. 10. Top scoring functions from IPA are shown in Supplementary Table 15.
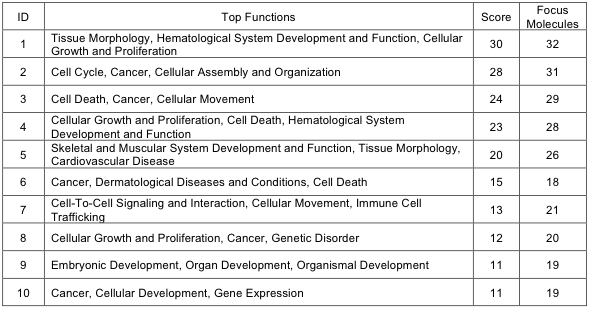
Supp. Table 15. Top scoring functions from IPA
4.2 Network analysis of DEGs, somatic mutations, and fusion genes
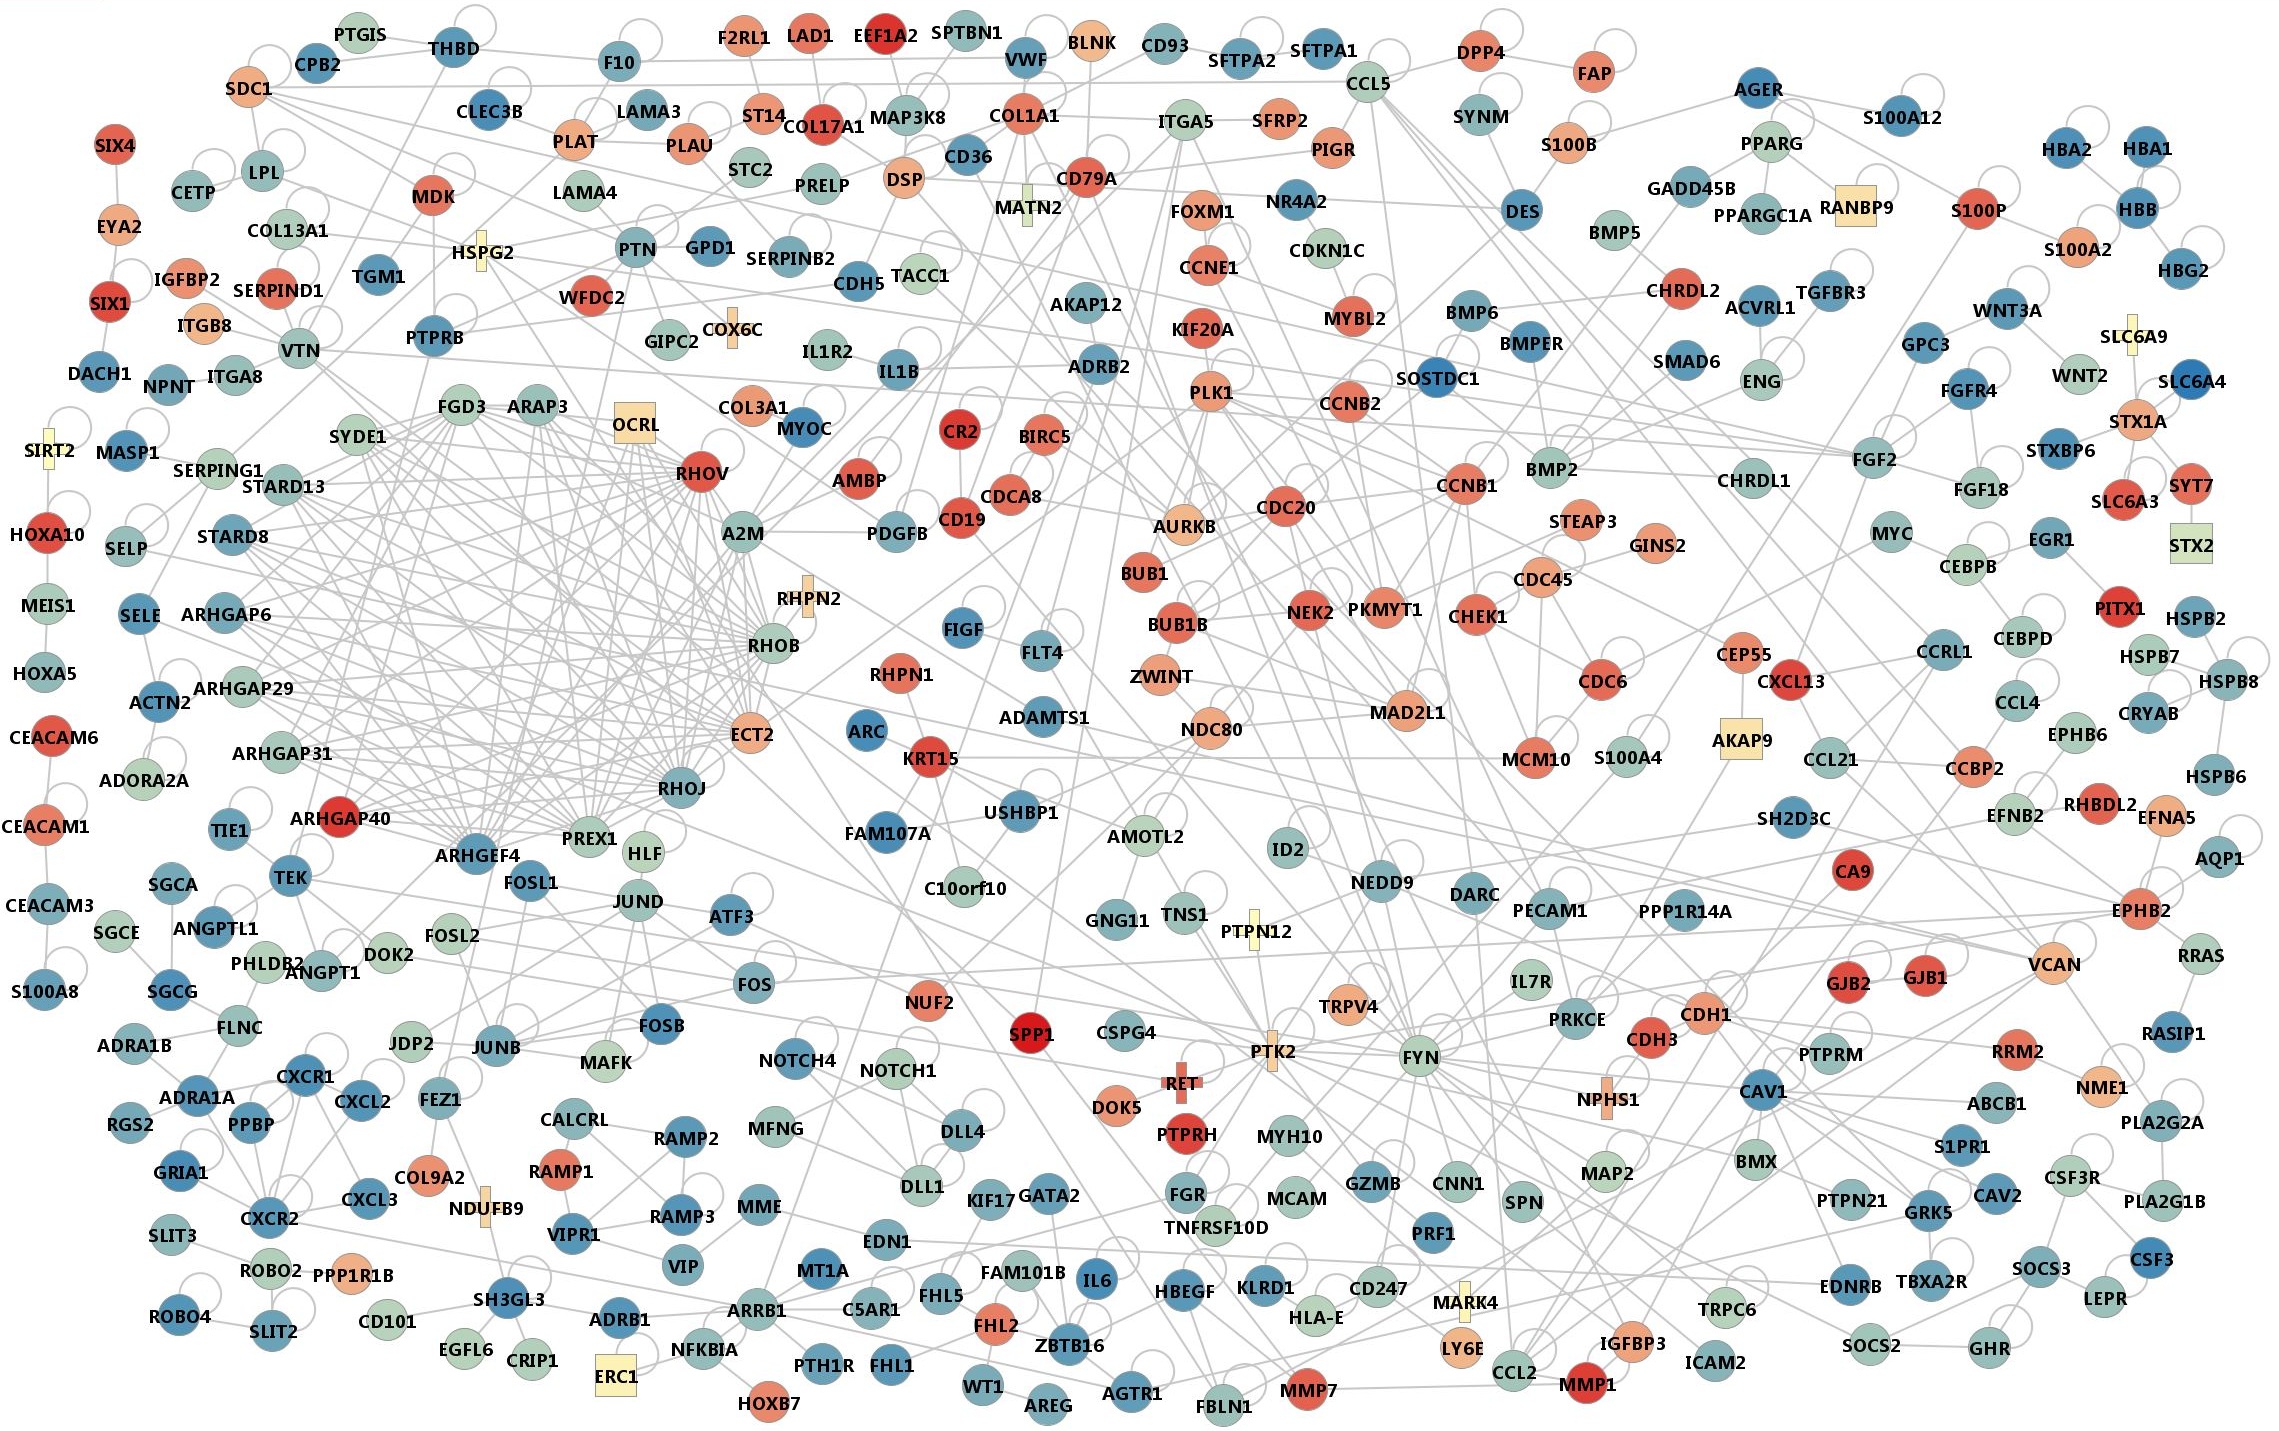
The molecular network for 1536 genes were constructed with the MIMI database (http://mimi.ncibi.org/MimiWeb/main-page.jsp, the last update on Apr. 29, 2010),) of protein-protein interaction (PPI). Supplementary Fig. 11 shows the overall PPI network created with the MONGKIE visualization software developed at our own center (http://mongkie.org, version 0.1Alpha).
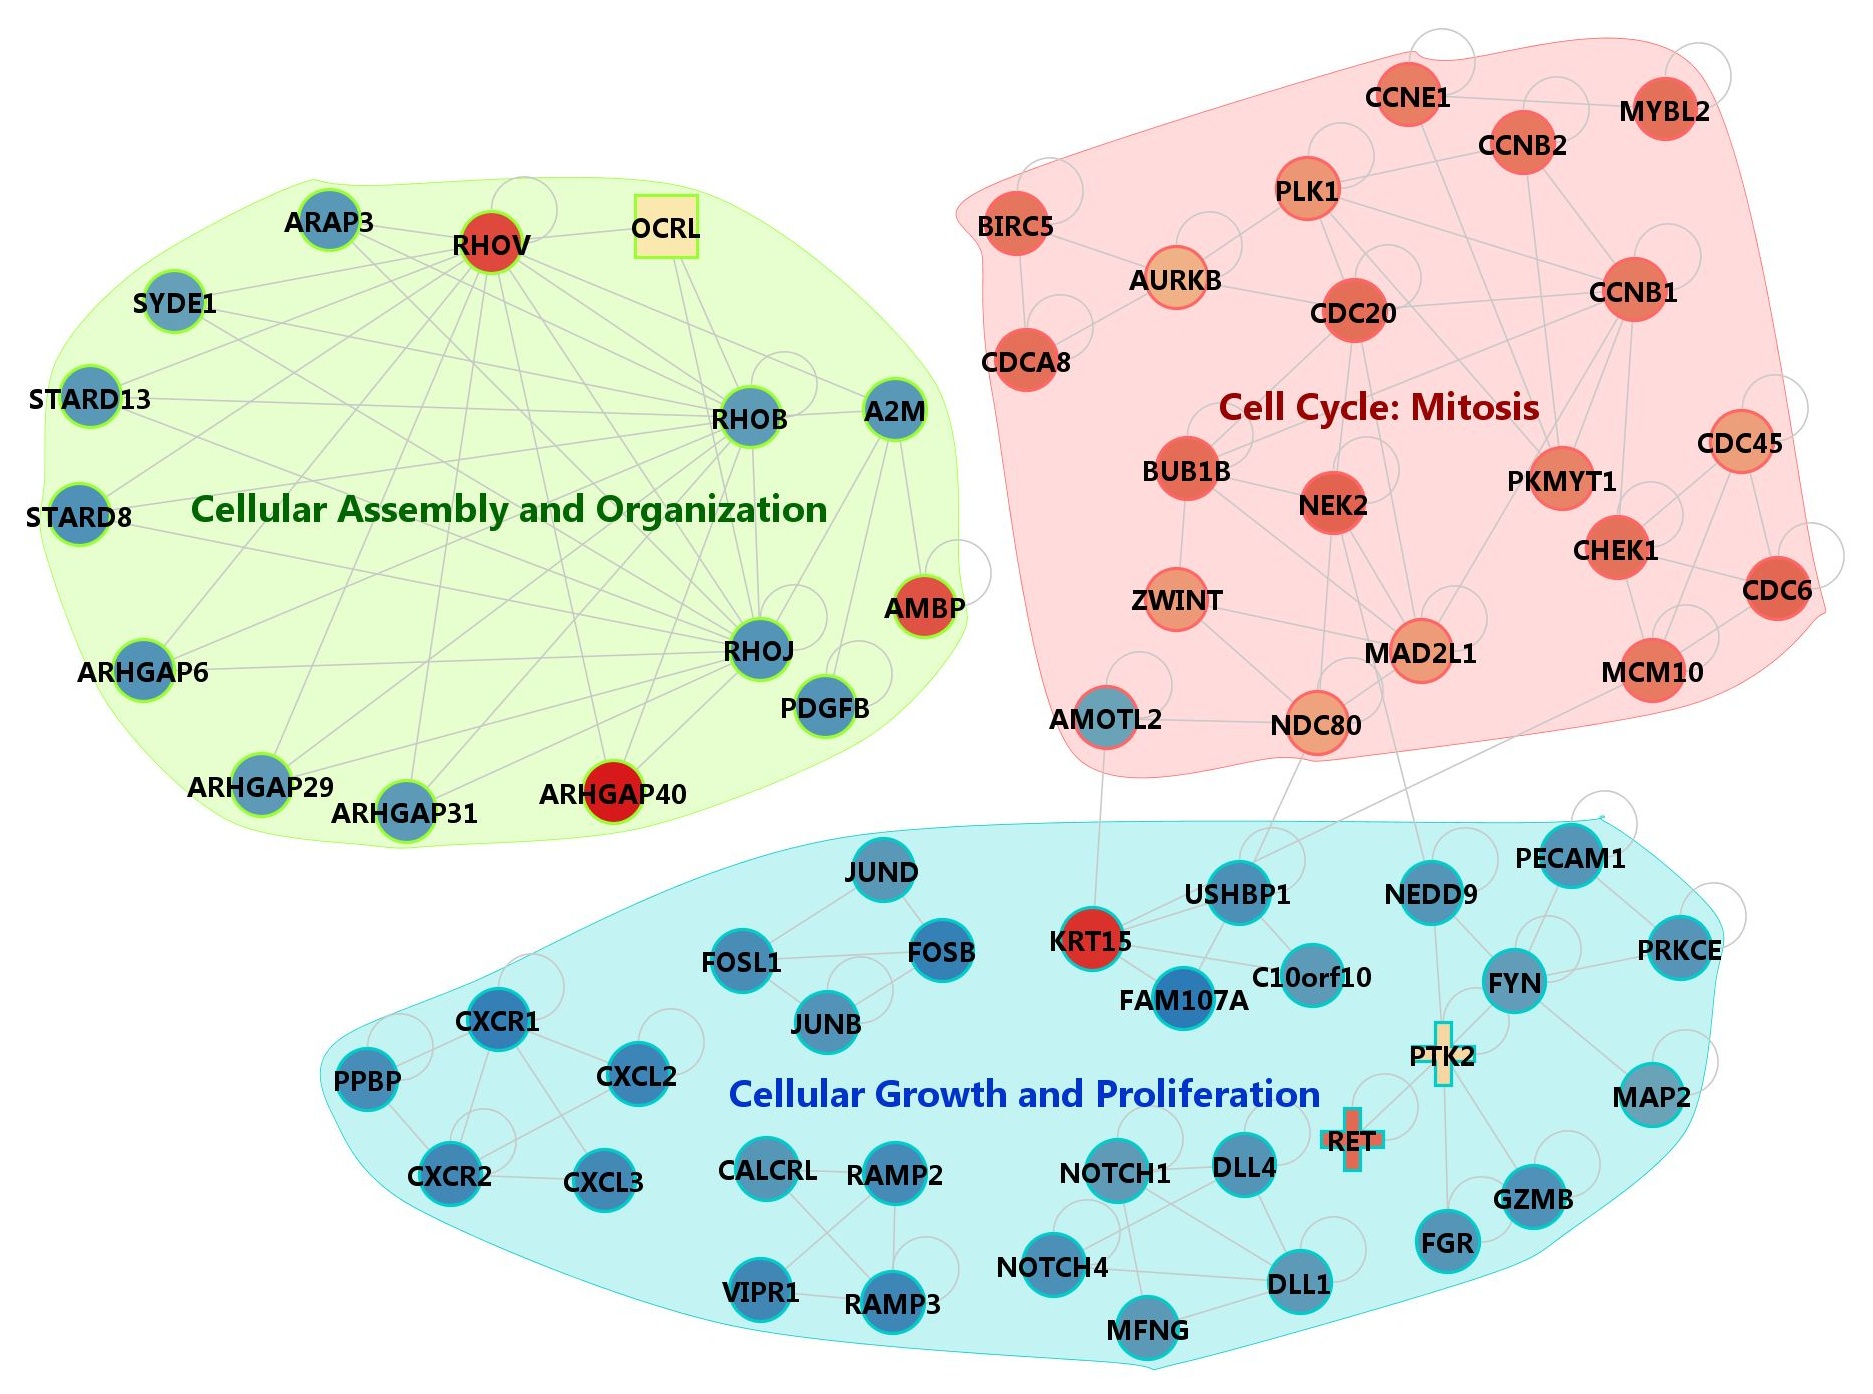
Supp. Fig. 11. Functional grouping of MCODE modules in 3 broad categories
To identify network modules of coherent function, we applied the MCODE (http://baderlab.org/Software/MCODE, version1.32) program to find densely connected network components. We used the default parameters except for the node score cutoff value of 0.5. We obtained 8 network modules shown in Supplementary Fig. 12. The full list of genes is provided in Supplementary File 5 with brief descriptions. Several modules from MCODE are involved in related functions. We were able to group the network modules into three broad functional categories as shown in Supplementary Fig. 13. Further analysis for biological meaning and pathway modeling is described in the main text.
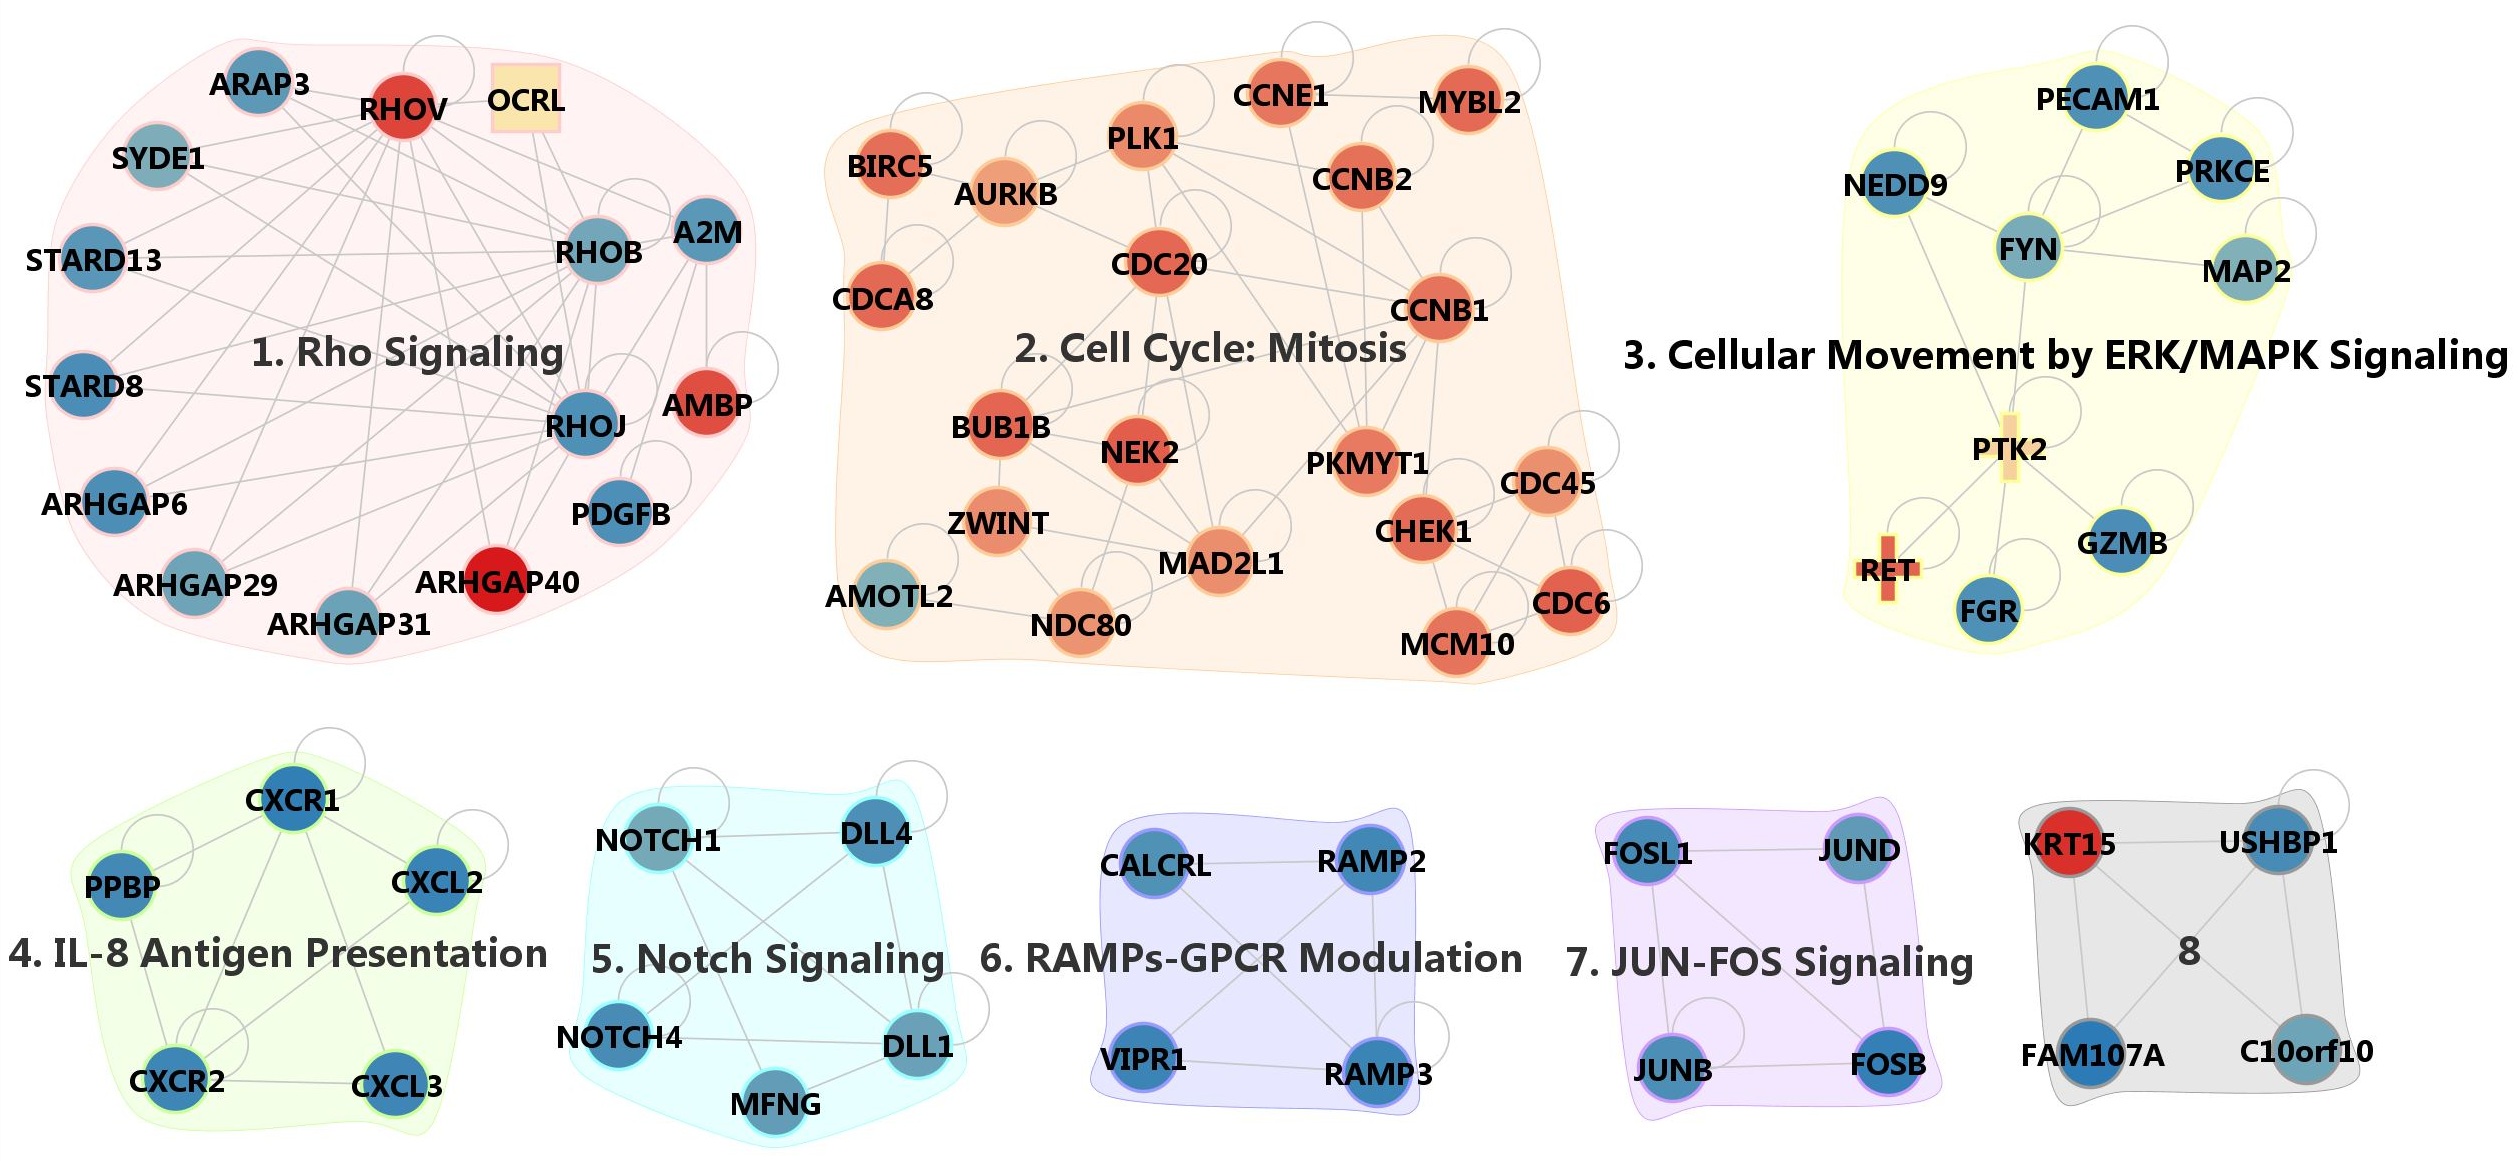
Supp. Fig. 12. Network modules from MCODE
Supp. Fig. 13. RNA-Seq data mapping summary