5. Miscellaneous
5.1 Comparison with public expression data
A number of microarray-based studies have been carried out on lung cancer. A logical question would be how our data compares with these previous studies. From public gene expression data on lung cancer in GEO and ArrayExpress databases, we identified 12 data sets each with both tumor and normal specimens. The parameters of each study including sex, disease subtype, smoking status, ethnic background, mutation information are summarized in Supplementary Table 16.
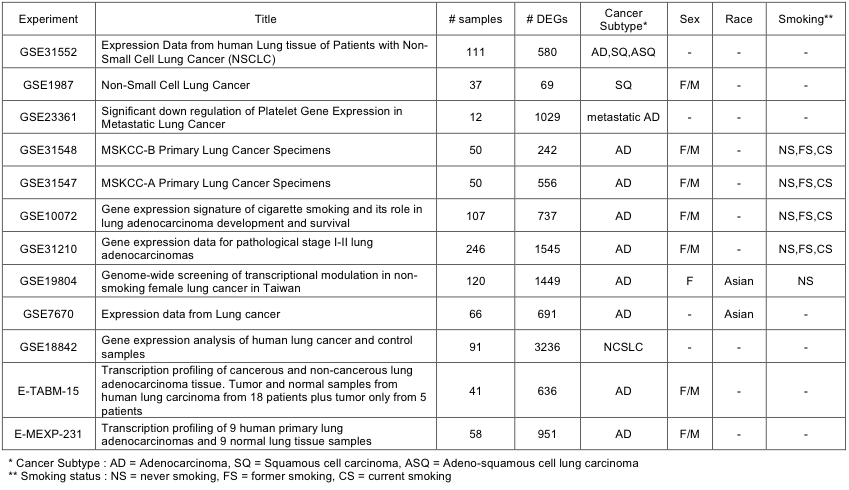
Supp. Table 16. Summary of public microarray data on lung cancer
To avoid the complications from meta-analysis (different platforms, labs, protocols, etc.), comparisons were done at the gene set level, not on expression values of individual genes. All array data were normalized with the RMA method, and DEGs were obtained by using the limma package in R with the adjusted p-value of 0.001.
The DEG sets from various experiments were clustered by hierarchical method. The distance metric was the hyper-geometric p-value of testing co-membership between two gene sets. Clustering of public experiments (Supplementary Fig. 14) indicates that our result is closest to that of GSE19804 which profiled never-smoker female lung adenocarcinoma in Taiwan. The fact that a study on a patient with virtually identical demographic characteristics yielded results most similar to ours provides an additional validation of the current study.
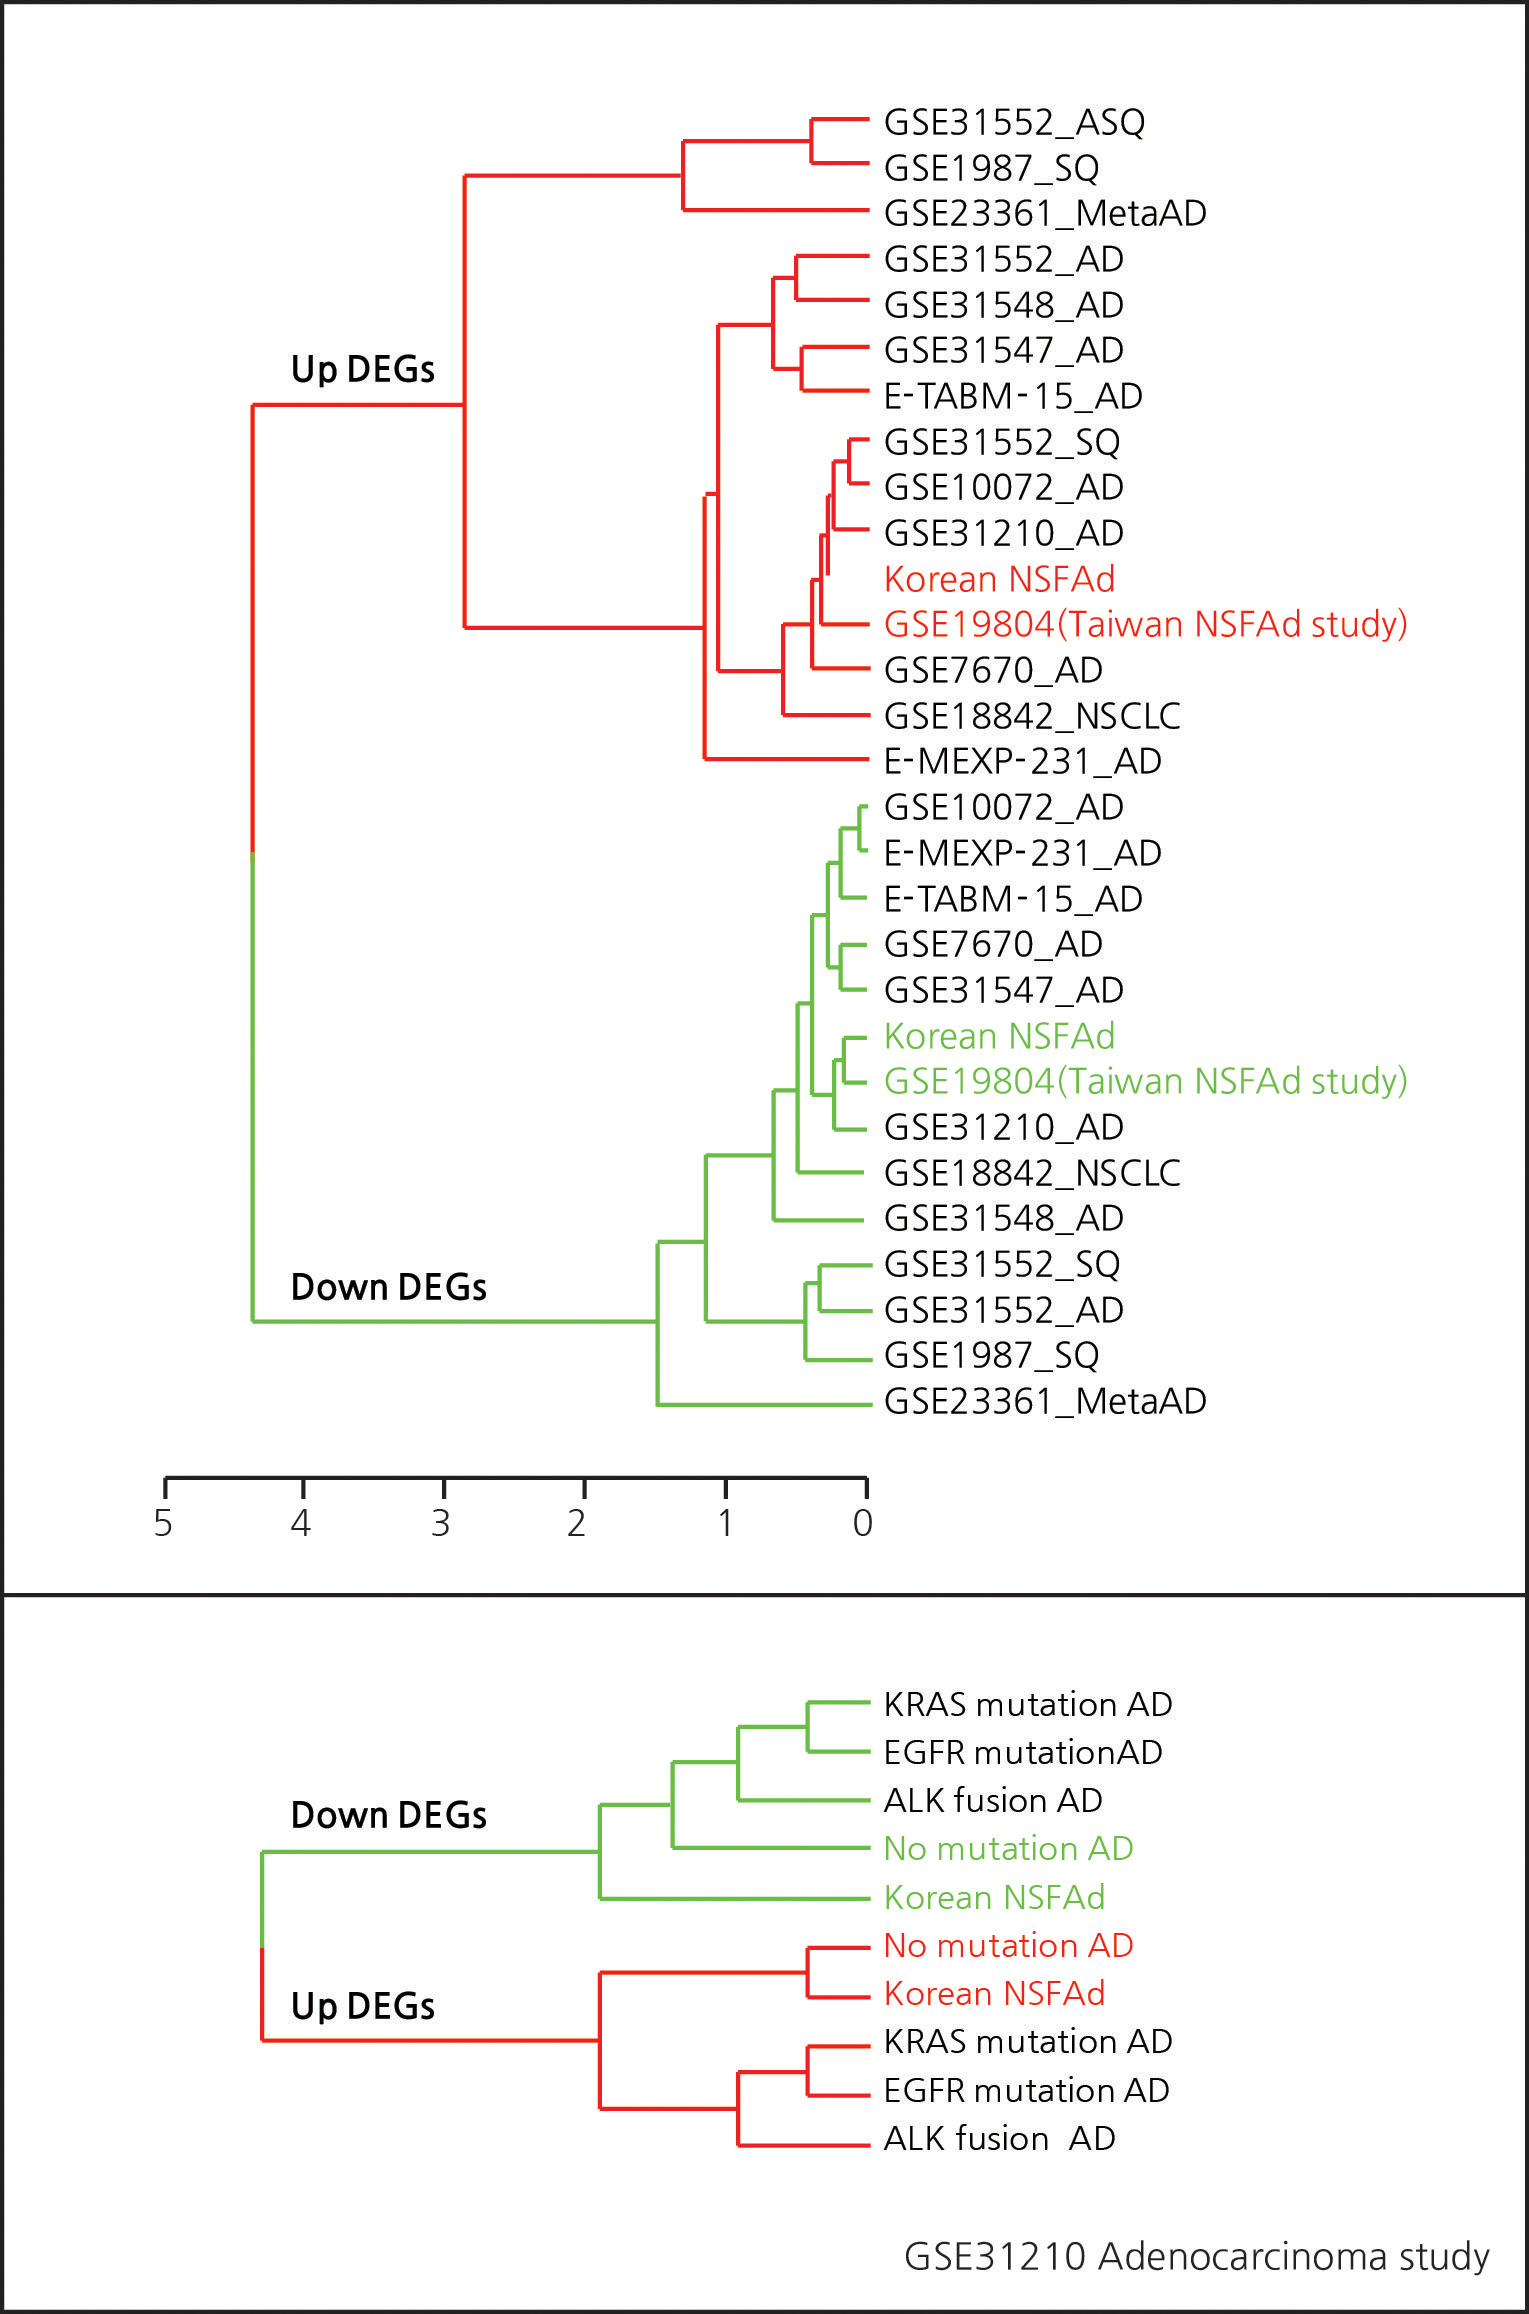
Supp. Fig. 14. Dendrogram of DEG sets from public microarray data
Patient grouping according to the mutation subtype is critical for selecting treatment methods. GSE31210 contains mutation information for EGFR, KRAS, ALK genes that are established as key biomarkers for subtyping lung adenocarcinoma. Comparing up and down DEG sets, our patient group was shown to be closest to the no-mutation group in GSE31210. Again, this provides further validation of our study given that all of our patients belong to no- mutation group. In sum, comparison with publicly available data not only confirmed the validity of our data set, but also raises an important and testable hypothesis that never-smoker female adenocarcinoma patients constitute a distinctive group from those with EGFR, KRAS, and ALK mutations.
5.2 Sample clustering with different types of omics data
Each type of omics data were used for sample clustering via the correlation heatmap. Supplementary Fig. 15(a-b) shows the correlation heatmaps from CNV data for all genes vs. for genes with significant copy number gain or loss. Even though two dendrograms were similar except P4T sample, the correlation heatmaps demonstrate a superior discerning power of copy number altered genes over all genes in that a clearer distinction between normal and tumor samples is seen. Similar arguments can be applied to other types of data as shown in Supplementary Fig. 15.
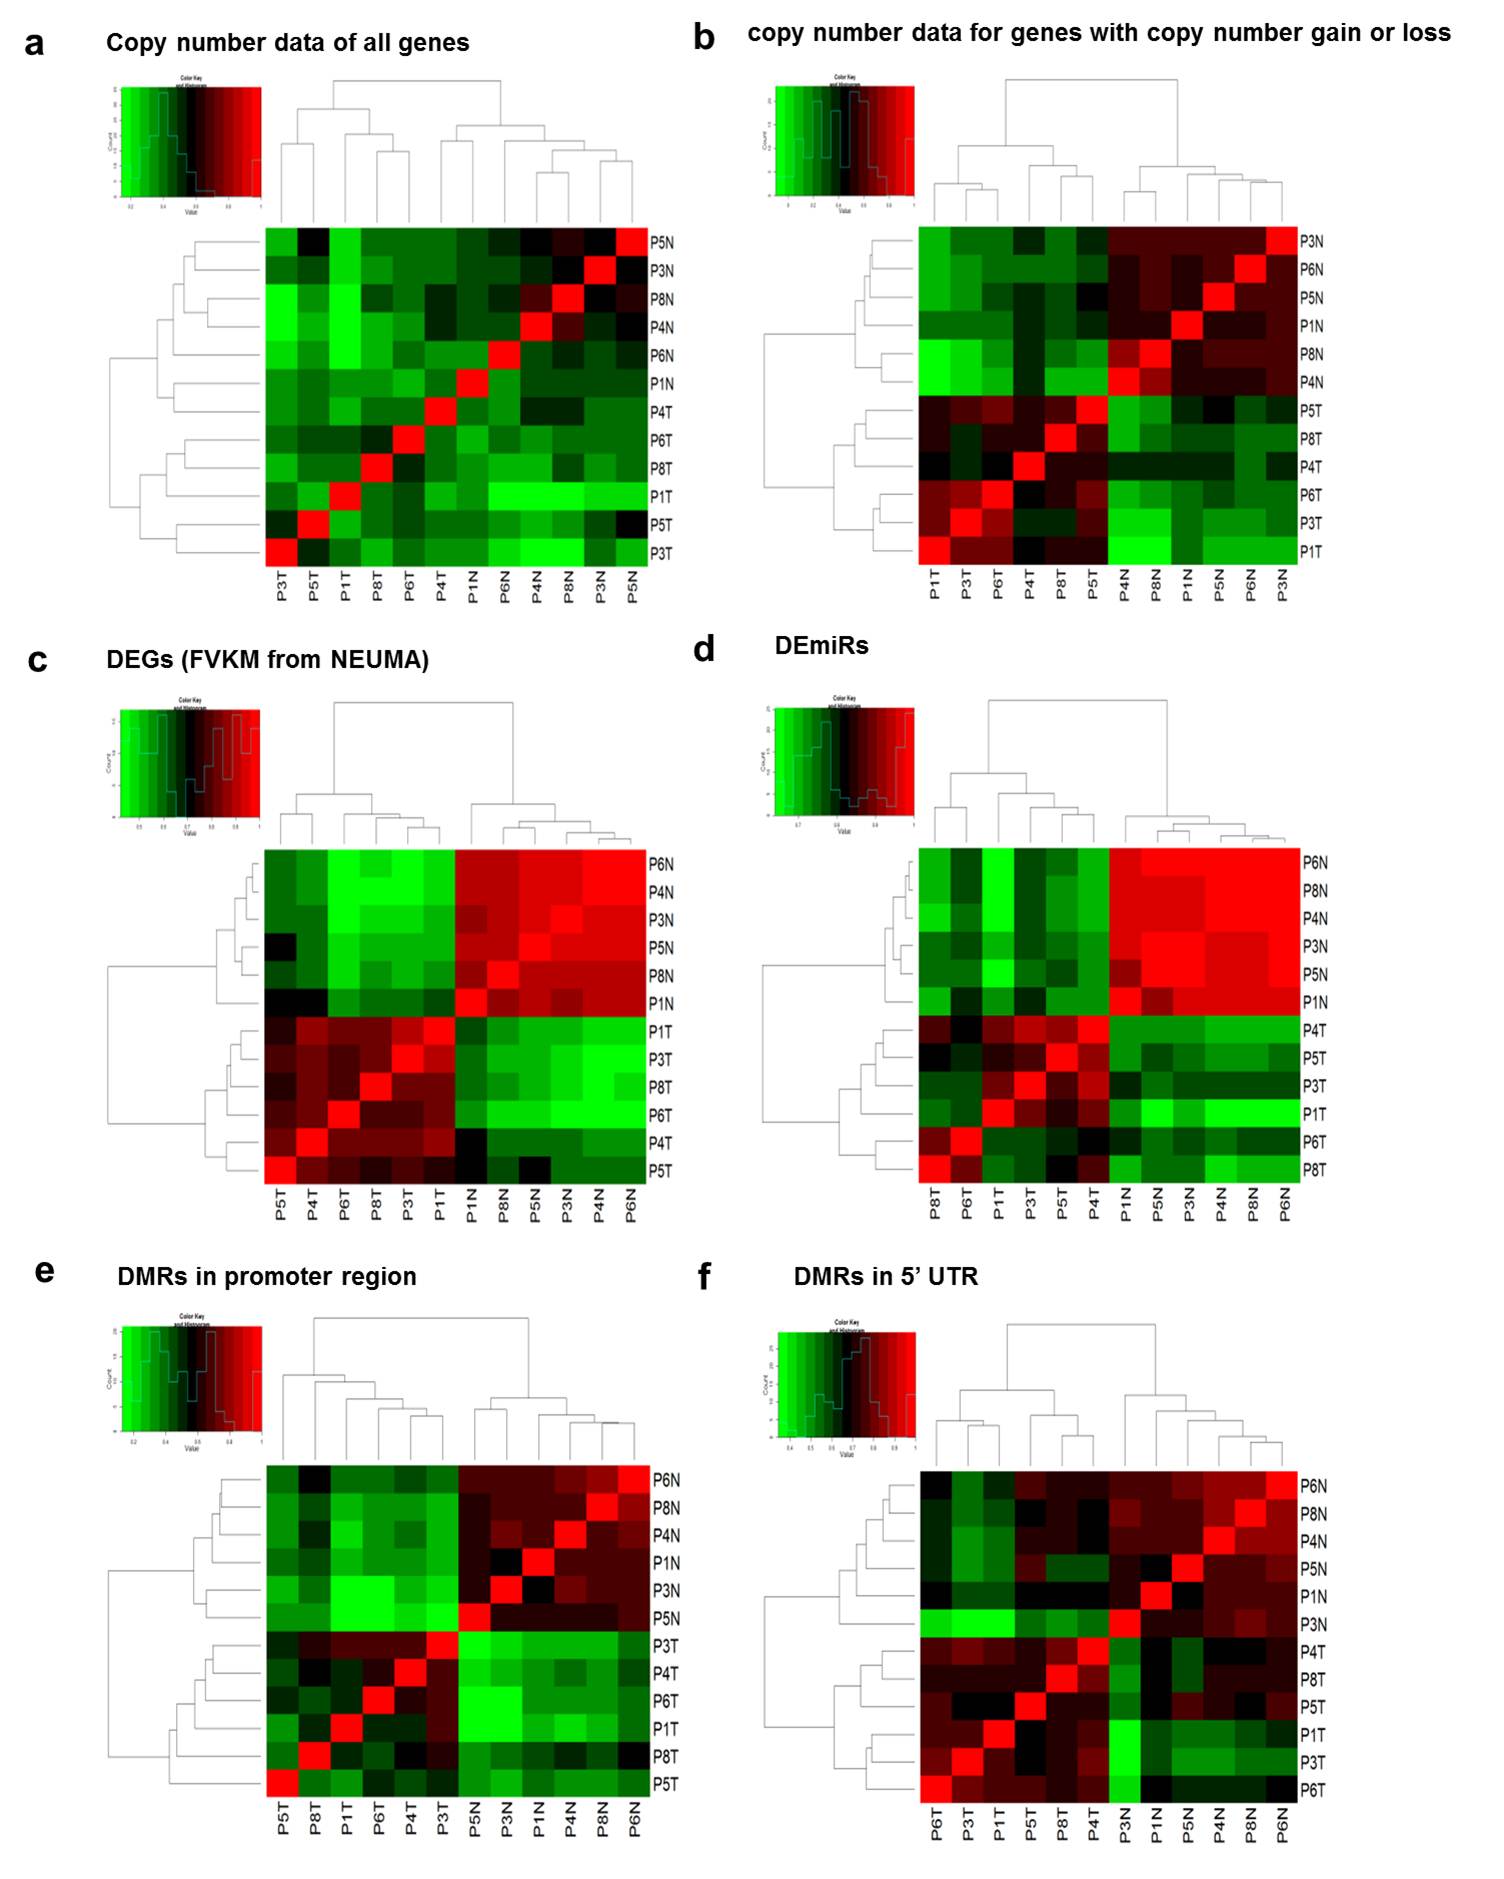
Supp. Fig. 15. Correlation heatmaps from copy number data, DEGs, DEmiRs, and DMRs
DNA methylation data (DMR) were divided into several groups based on the site of methylation: promoter, 5’ UTR, CDS, 3’ UTR regions. Correlation heatmaps of promoter and 5’ UTR but not of CDS and 3’UTR identified tumor and normal groups successfully. This is consistent with that DNA methylation in promoter or 5’ UTR is an important regulatory event.
We examined the mean and variation values for within-group and between-group correlation coefficients (Supplementary Table 17). Good classifiers should have a large difference between within- and between-groups in the mean values and should also show small variations. We found that mRNA expression (DEG and DEI) best meets this criterion. DEmiRs showed the highest correlation coefficients for the within-group samples, but the between-groups value was rather large. Nevertheless, the correlation heatmap showed an excellent separation between normal and tumor groups. Copy number alterations and DMRs in promoter regions showed a clear distinction as well. Low correlation values in the tumor group may indicate that the tumor group needs to be subdivided for meaningful analysis, but this would require a much larger number of samples.

Supp. Table 17. Mean and standard deviation values of correlation coefficients