3.1 Array CGH Data Analysis
Array CGH experiments were performed using the Agilent 1M chip with a sex-matched normal human DNA sample as the universal control. We subtracted the background intensity from the total spot intensity. To remove systematic biases in the chip assay, a within-slide normalization was applied using Lowess normalization for log2 transformed data. The copy number plot for normal samples revealed that none of the normal samples showed any significant copy number alteration. The copy number gain or loss, i.e. log2(tumor/normal) was plotted by the chromosome number for each patient in Supplementary Fig. 7. Five out of six patients except P5 showed significant copy number alterations in tumor samples.
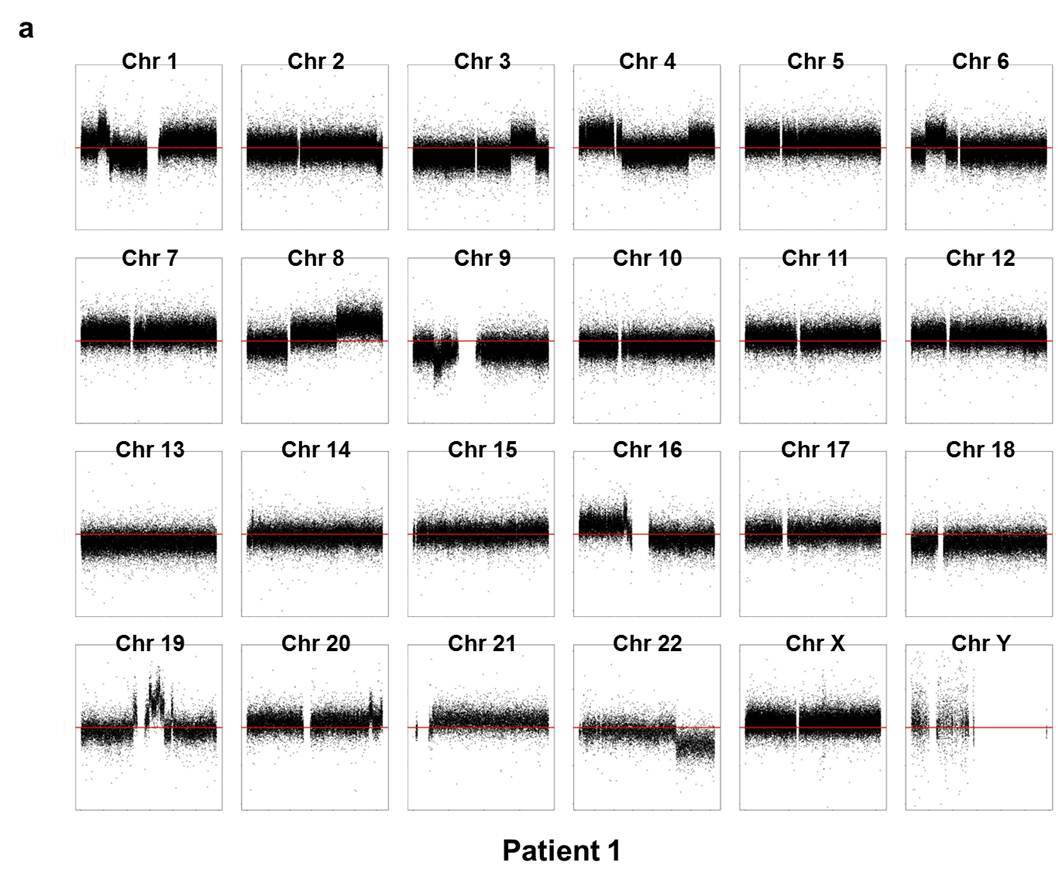
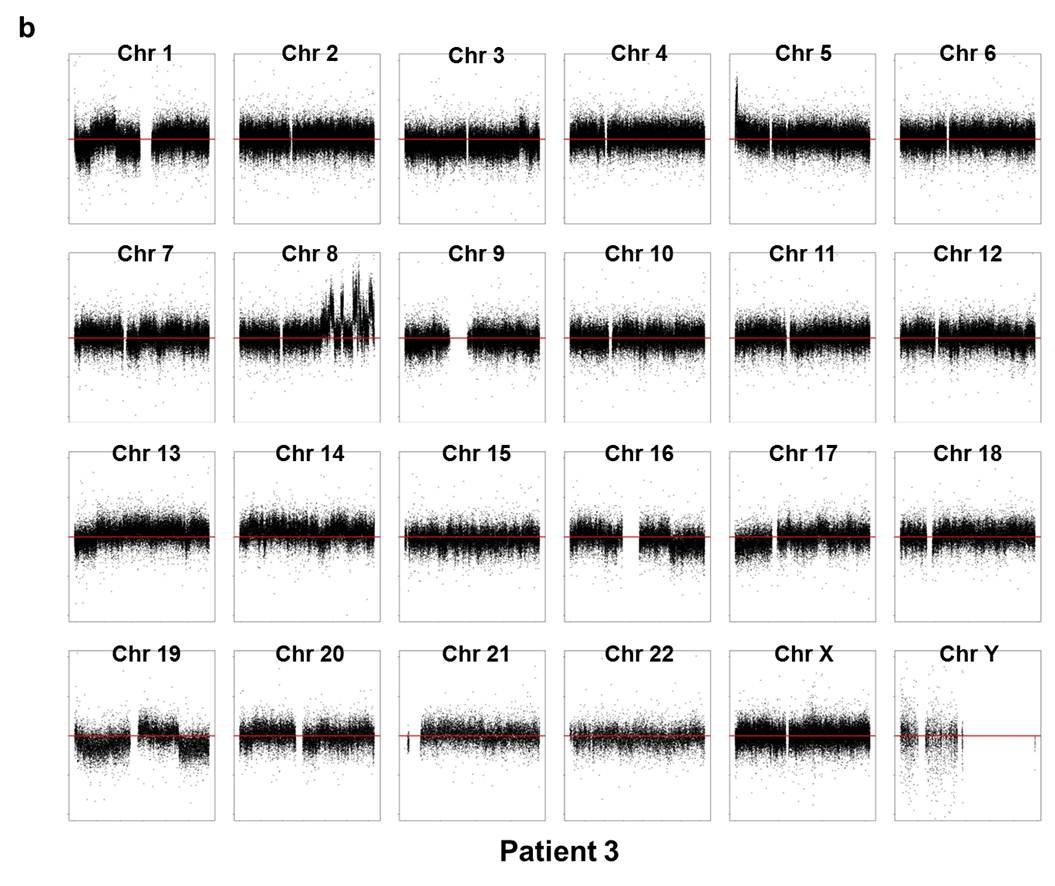
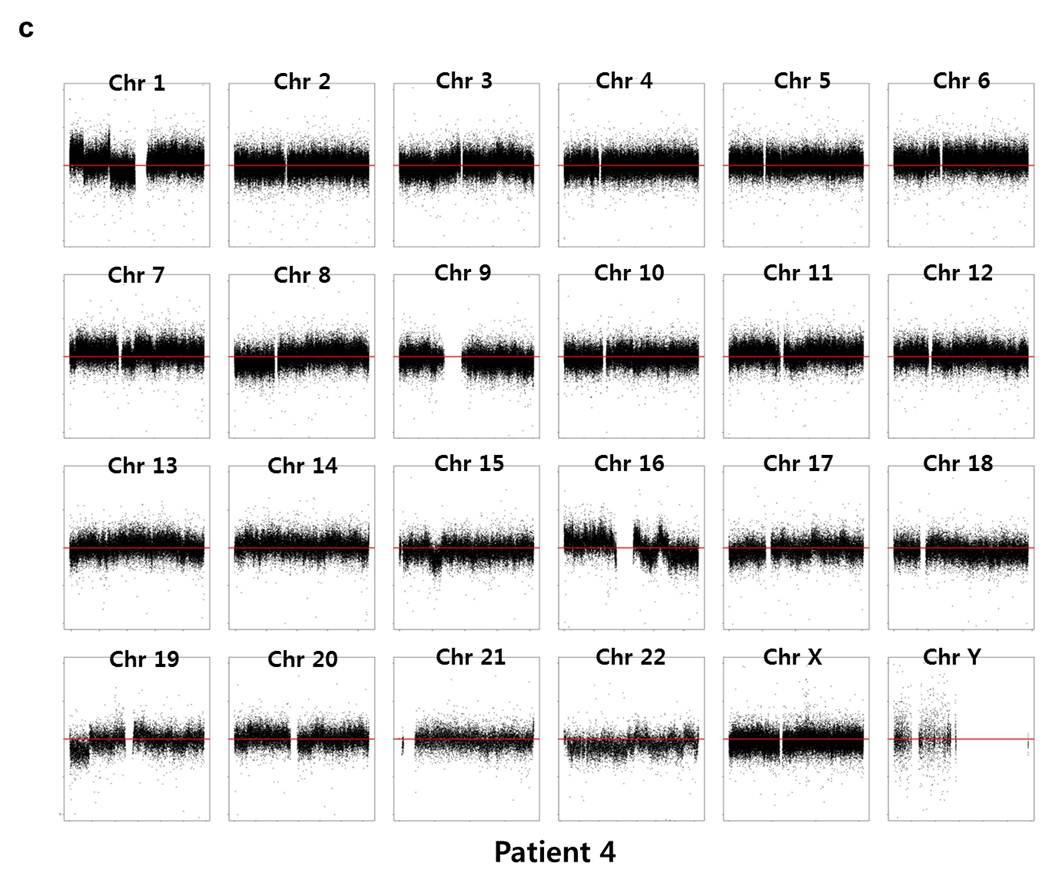
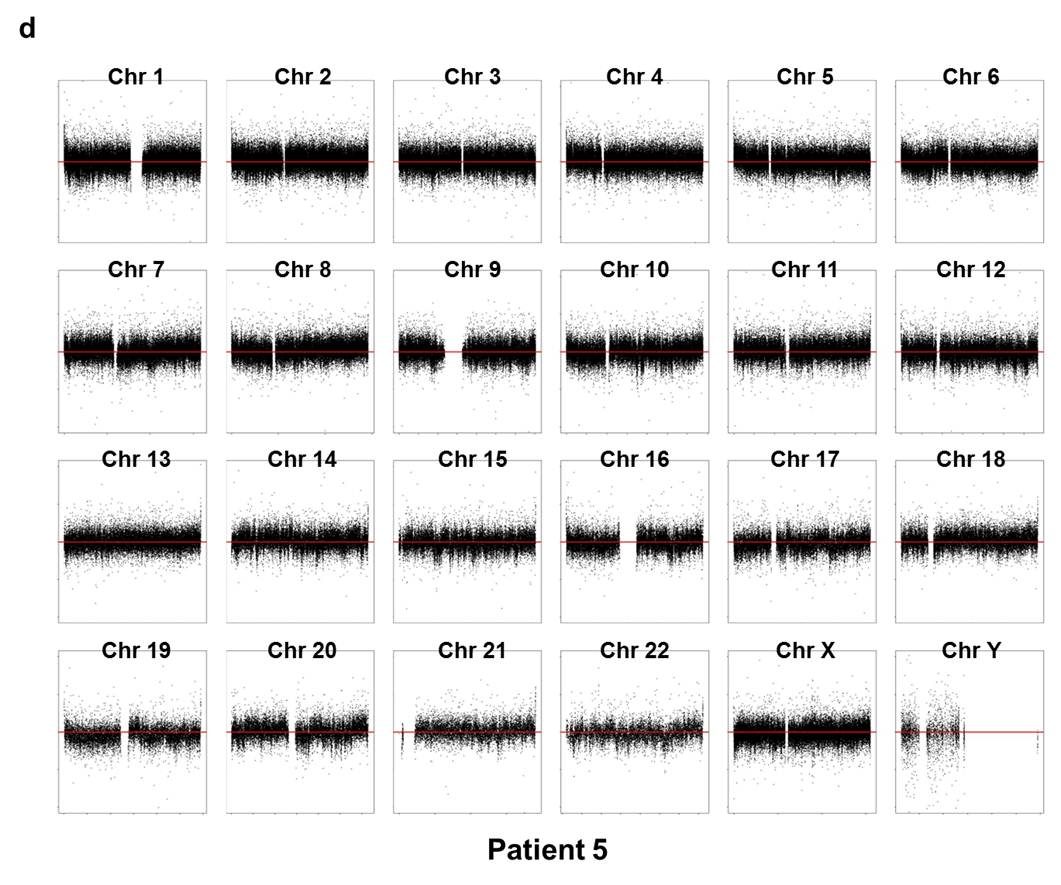
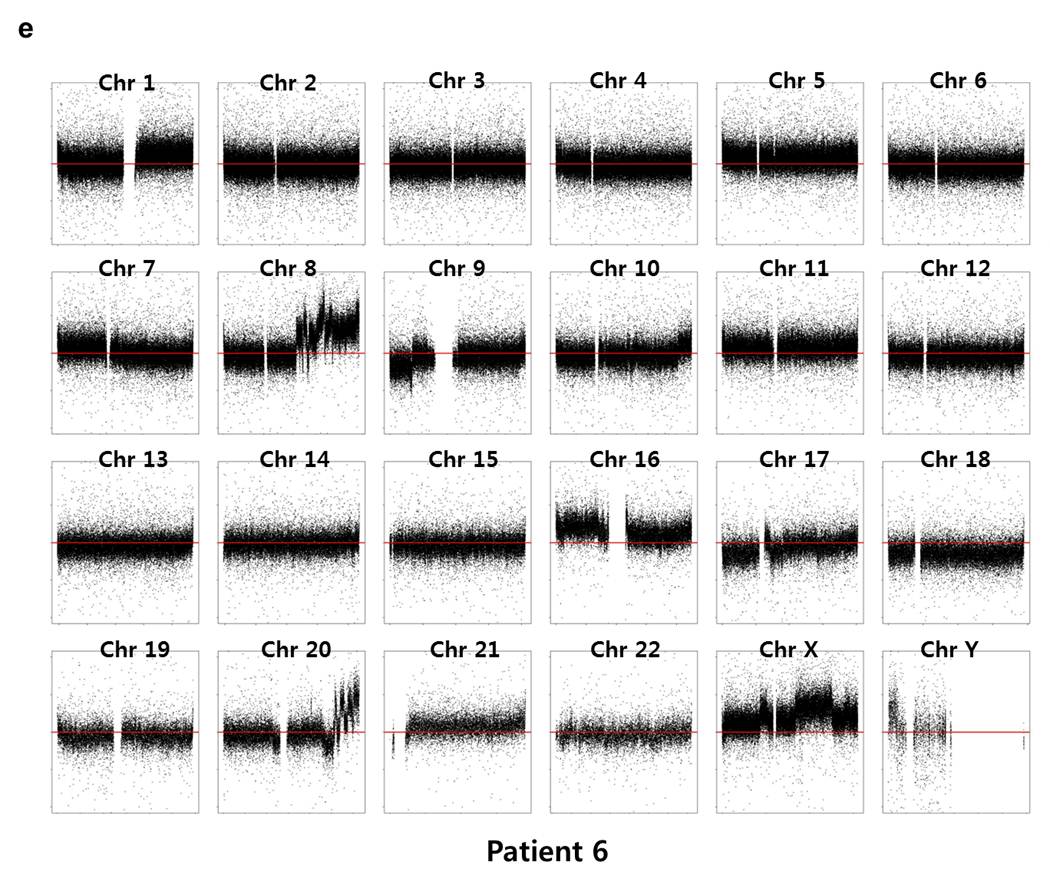
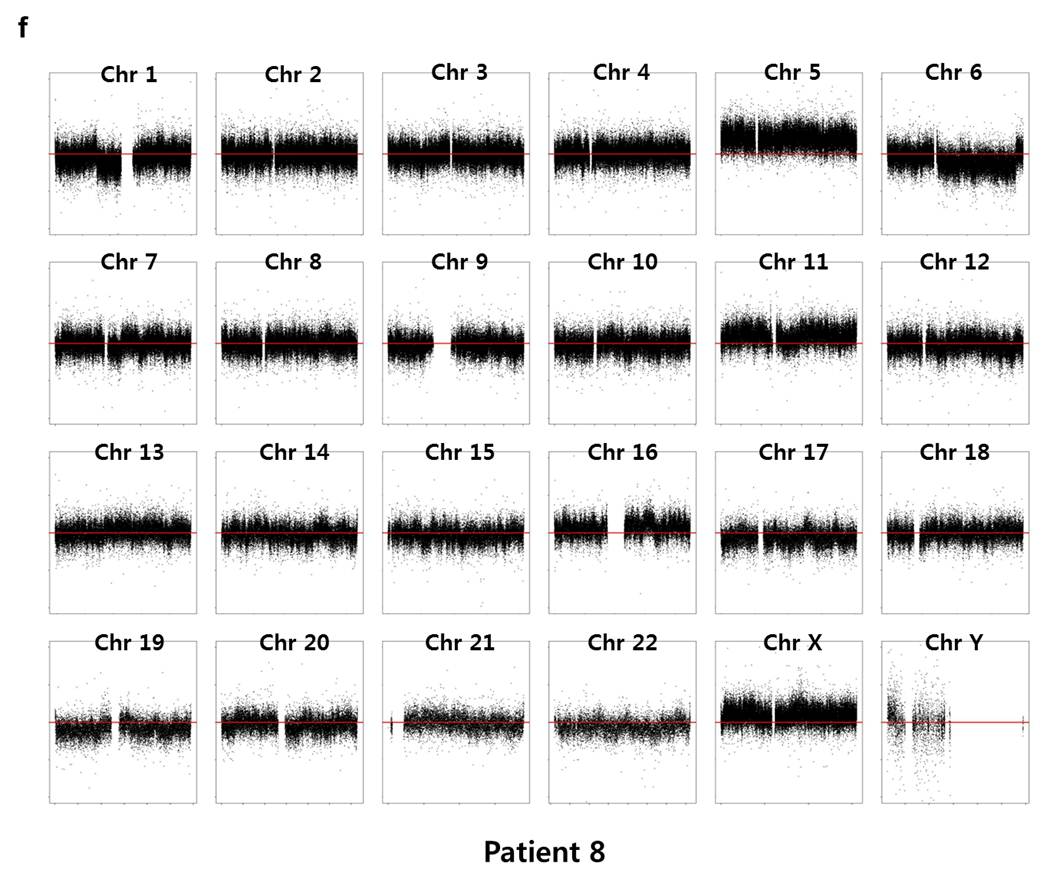
Supp. Fig. 7. CNV plot by chromosome for each patient
We used the circular binary segmentation method17 (CBS) for detecting statistically significant somatic copy number alterations. Copy number gain or loss beyond log2(tumor/normal) = ±0.3 (corresponding to the range outside 1.62~2.46 copies) was catalogued for each patient. Supplementary Fig. 8 shows the copy number altered regions in all six patients. We found multiple significant copy number gains in chromosomes 1, 5, 8, 16, 19, 20, X, and copy number losses in chromosomes 1, 6, 9, 16, 17, 18, 19, 22.
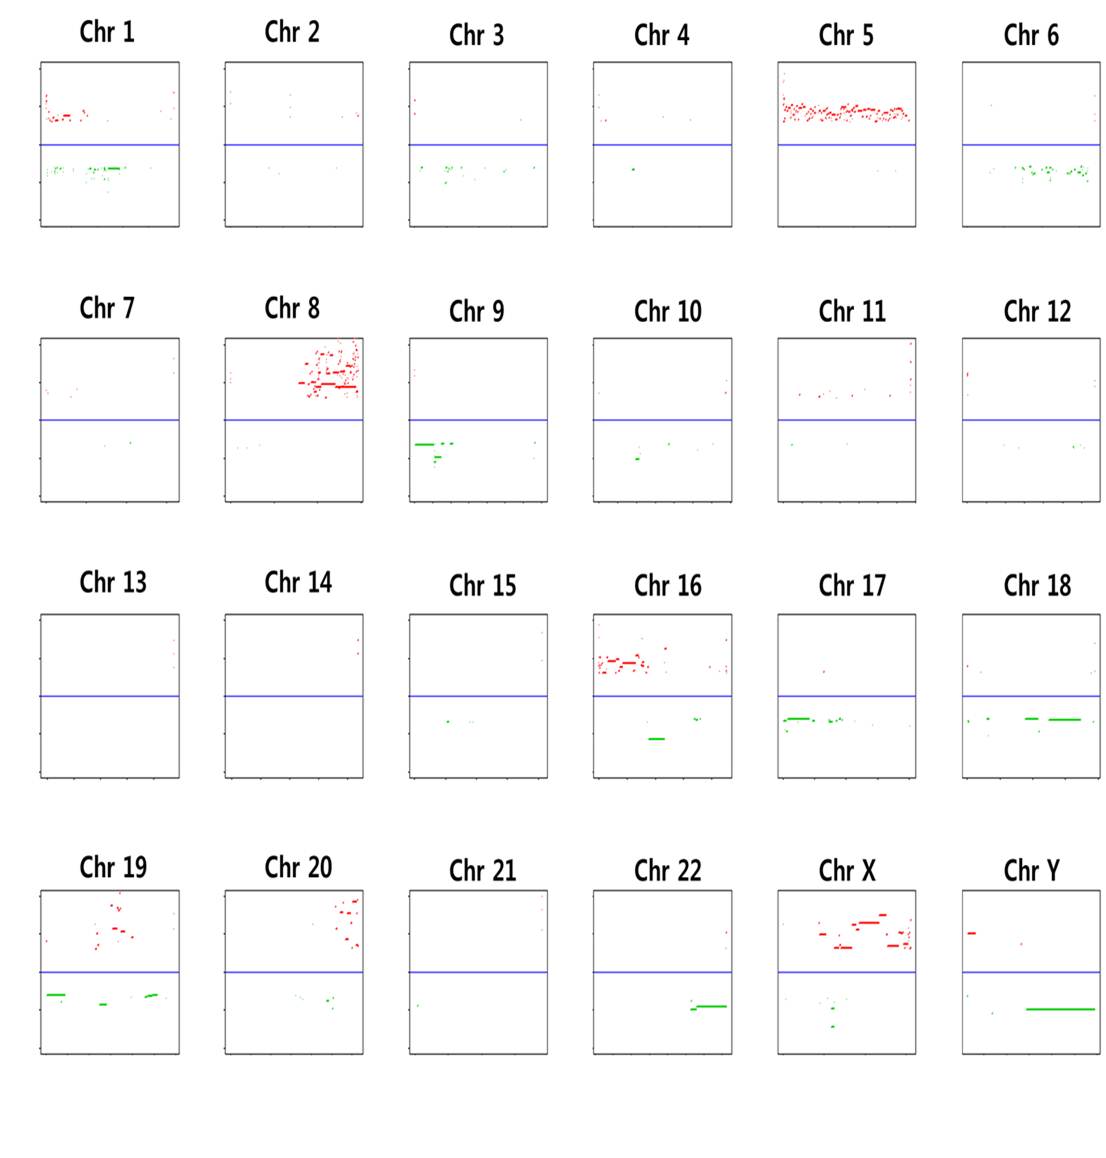
Supp. Fig. 8. Genomic regions with copy number gains or losses
We compared the genomic loci of copy number gains or losses with previous studies (Supplementary Table 10). Our data agreed best with Job et al. data that profiled 60 adenocarcinoma samples of never-smokers18. Genomic loci of 5p, 8q24, 20q13 were repeatedly detected as copy number gains, and 9p21 was consistently lost in copy number. Other markers may be never-smoker female specific, which needs to be validated with additional patient samples.
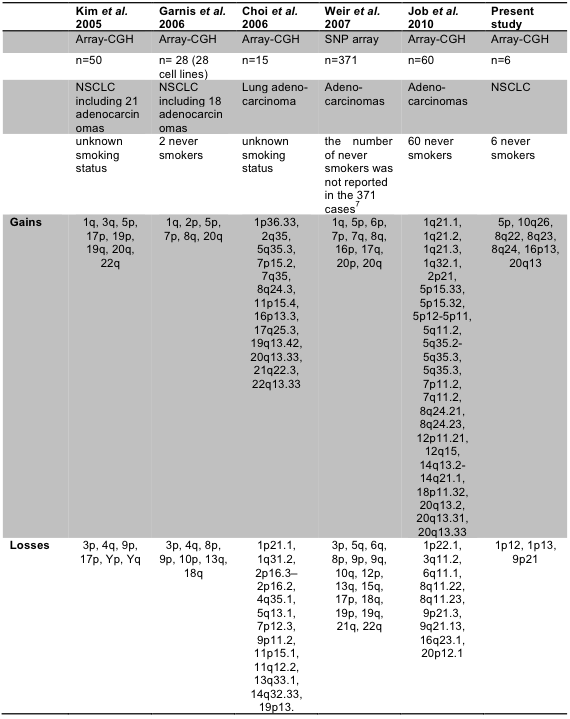
Supp. Table 10. Gain and loss in previously published papers and in present study
Supplementary Table 11 shows the summary statistics of copy number altered genes and regions in each patient. Genes whose copy number was altered in at least three patients are provided in the Supplementary File 3.

Supp. Table 11. Number of genes with CNAs outside 1.62~2.46 for each patient