2. Transcriptome Analysis
2.1 RNA expression analysis
We used the NEUMA program for quantifying transcript abundance. Since NEUMA maps sequence reads to the established transcriptome, identification of novel isoforms is not supported. However, its major merit is the accuracy of quantification as its algorithm mimics the process of real time PCR (agreement ratio over 0.9 with the experimental data).
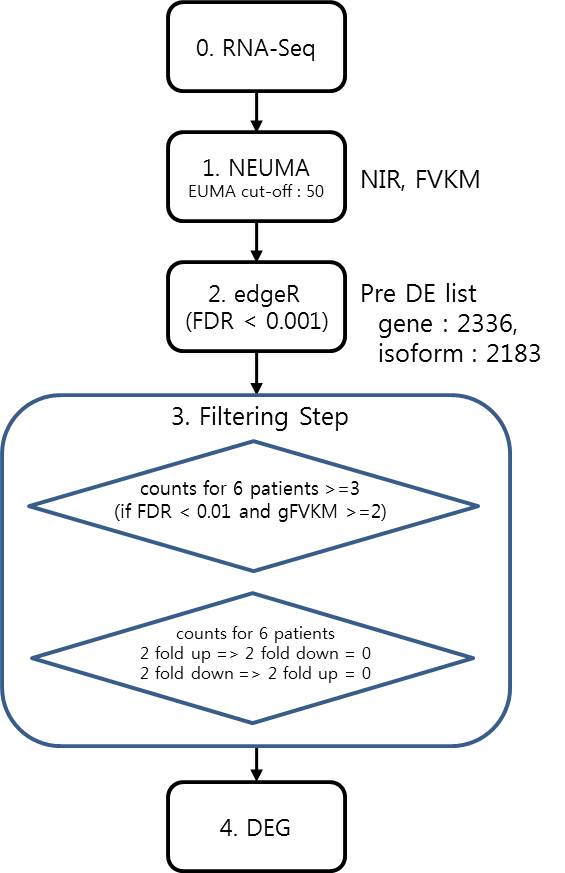
( Workflow for transcriptome data analysis )
2.2 Fusion gene analysis
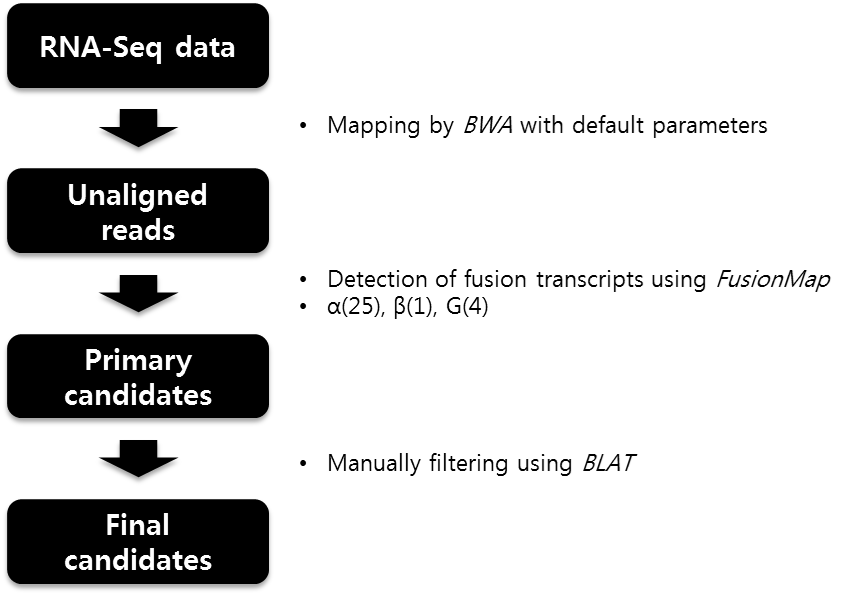
( Workflow for detection of fusion genes (FusionMap) )
2.3 Samll RNA-seq analysis
The workflow for analyzing small RNA-Seq data is shown in Supplementary Fig. 4. In this study we focused on microRNA exclusively even though our raw sequencing data included other types of small RNAs as well. Our analysis consists of four parts - mapping, normalization and quantification, identification of differentially expressed microRNAs (DEmiRs), and identification of microRNAs anti-correlated with DEGs. Sequence reads were mapped with Bowtie V.0.12.7 with the perfect match option onto the known microRNA database (miRBase release 17) after removing adaptor sequence (5'ATCTCGTATGCCGTCTTCTGCTTG).
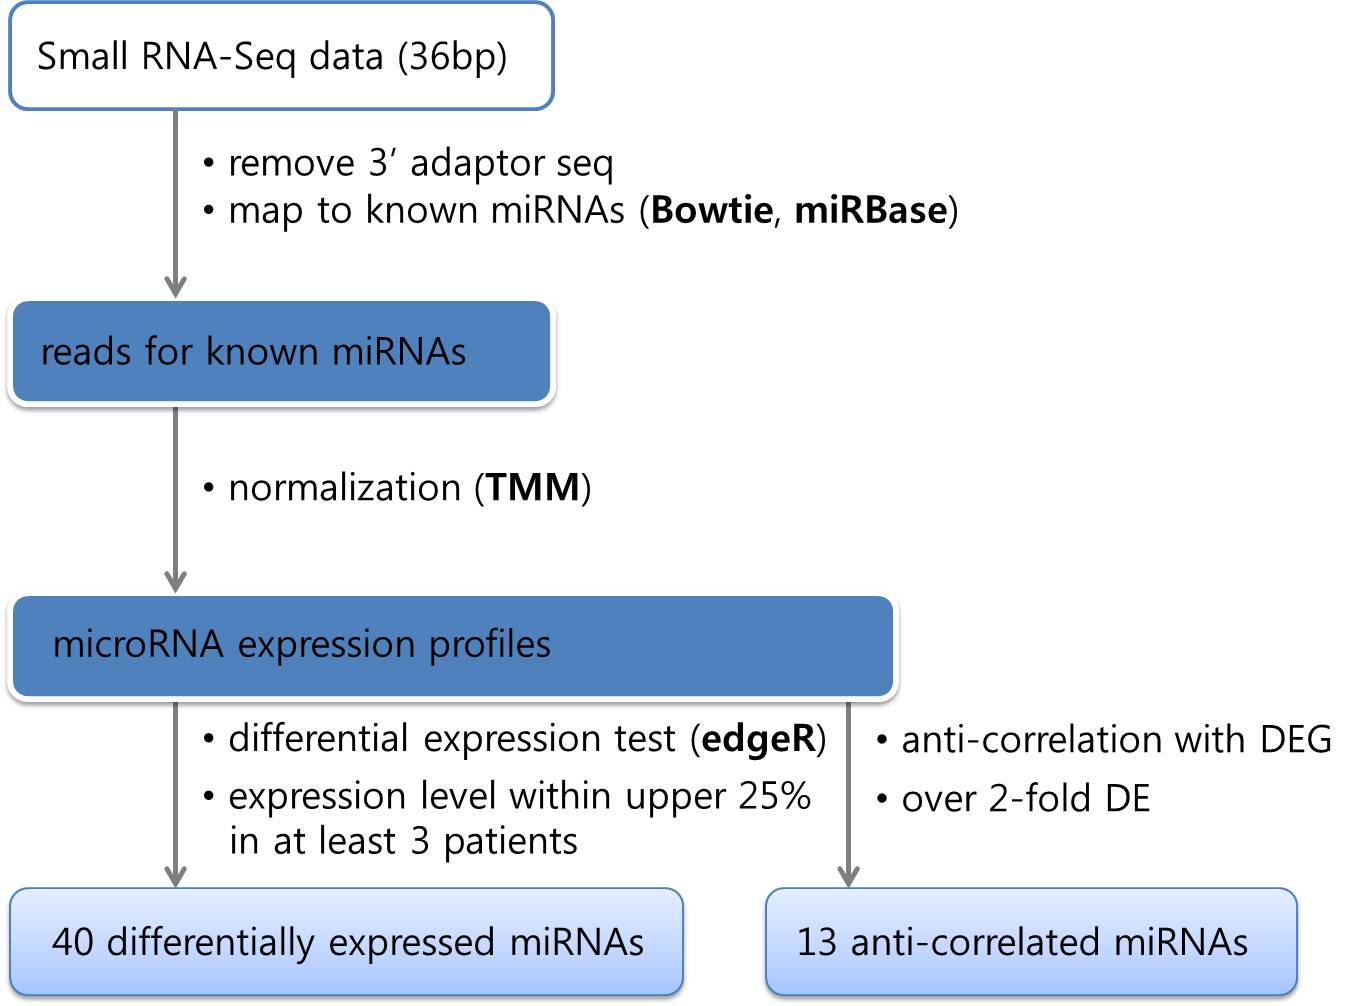
Supp. Fig. 4. Workflow for analyzing small RNA-Seq data