3. Array CGH and MeDIP-Seq Data Analysis
3.1 Array CGH Data Analysis
Array CGH experiments were performed by using the Agilent one million chip with sex-matched normal human DNA sample as a universal control sample. We subtracted the background intensity from the total spot intensity. To remove systematic bias in the chip, the within-slide normalization was applied by using Lowess normalization for log2 transformed data. The copy number data for normal and tumor samples were manually inspected. All normal samples did not show any significant copy number alteration (CNA), whereas five out of six tumor samples showed apparent CNAs. We used the circular binary segmentation method (CBS, Olshen et al. 2004) for detecting statistically significant somatic CNAs. Copy number gain or loss beyond log2(tumor/normal) = ±0.3 (corresponding to the range outside 1.62~2.46 copy number) were catalogued for each patient.
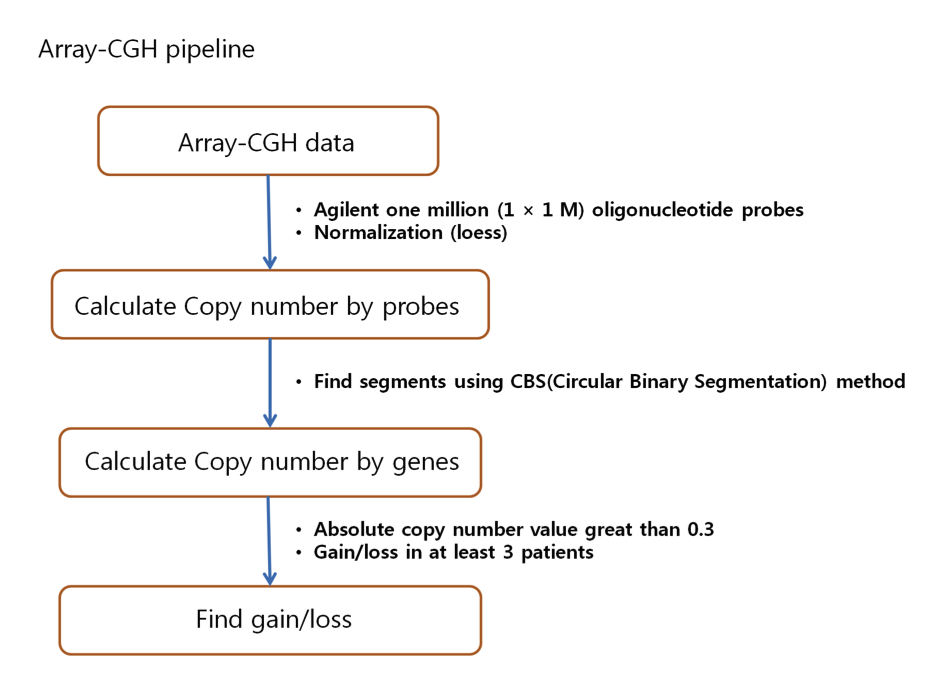
( Workflow for analyzing Array-CGH data )
3.2 MeDIP-Seq data analysis for DNA methylation
Single-end reads from MeDIP-sequencing were mapped to the human reference genome (build 19) using the alignment software Eland (version 2) with default parameters. The reads with base quality less than 20 and redundant reads were removed from further analysis. The unique reads for each patient was about 15.4 million (37.6%) on average. All aligned unique reads were extended to 200 bp long to compensate for the difference in read length and undetermined methylation sites.
We calculated the differentially methylated regions (DMRs) using edgeR program with the FDR cutoff value of 0.05. We did not use the methylation level as additional cutoff for MeDIP-Seq data. In total, we found 558 DMRs that were located in 138 promoter, 38 CpG, 281 5’UTR, 78 exon or intron, 23 3’UTR regions. The genome annotation data were downloaded from the UCSC genome browser database for hg19. Almost 75% were in promoter or 5’ UTR regions.
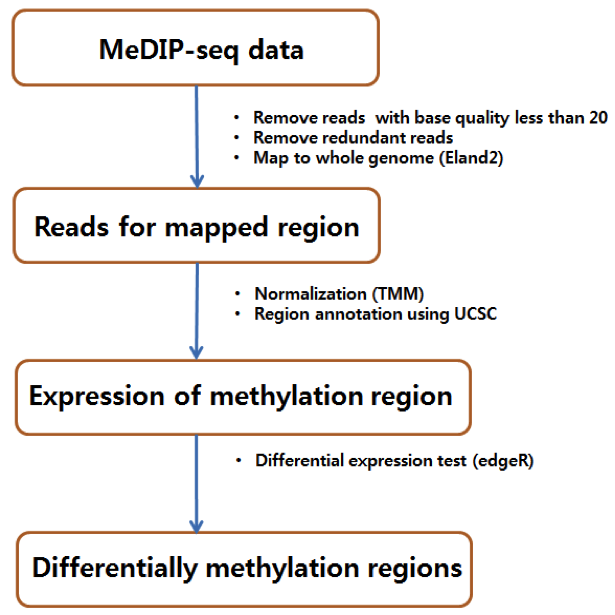
( Workflow for analyzing MeDIP-Seq data )